This project aims to provide insightful and interactive data visualizations for Airbnb listings in Antwerp, Brussels, and Ghent. The primary objective is to assist tourists in finding the most affordable and high-rated accommodations by offering a comprehensive understanding of the market.
The project involves a complete data pipeline, starting from raw Excel data, which undergoes an Extract, Transform, Load (ETL) process performed in Qlik Sense to ensure data quality and structure. This cleaned and transformed data is then meticulously organized through data modeling in a star schema. Subsequently, a Qlik Sense dashboard is developed, featuring handpicked visualizations designed to present the data effectively, which then integrates into a frontend for interactive display.
The dashboard will deliver key insights through visualizations of average nightly rates per city, popular cities for Airbnb rentals, and types of properties available including private rooms, shared rooms, or entire homes/apartments. Key information also visualized includes the availability of rooms over the past year, reviews and ratings distribution, demand based on seasons, and property distribution across the chosen cities.
Background and Approach
I was provided with a dataset containing Airbnb information for Antwerp, Brussels, and Ghent. My initial step involved defining specific requirements and formulating a storytelling flow to guide the project's direction. To ensure the robustness and accuracy of my data model, I engaged with an Epic Data employee, incorporating their expert suggestions. Subsequently, I developed an ETL/ELT pipeline to process and transform the data. The core visualizations were then built using Qlik Sense Client, and these dashboards were seamlessly integrated into a local frontend webpage using simple HTML and CSS. This end-to-end approach ensures a user-friendly dashboard with filters for preferences such as budget and property type, making it easy for tourists to explore and find listings.
Data Model
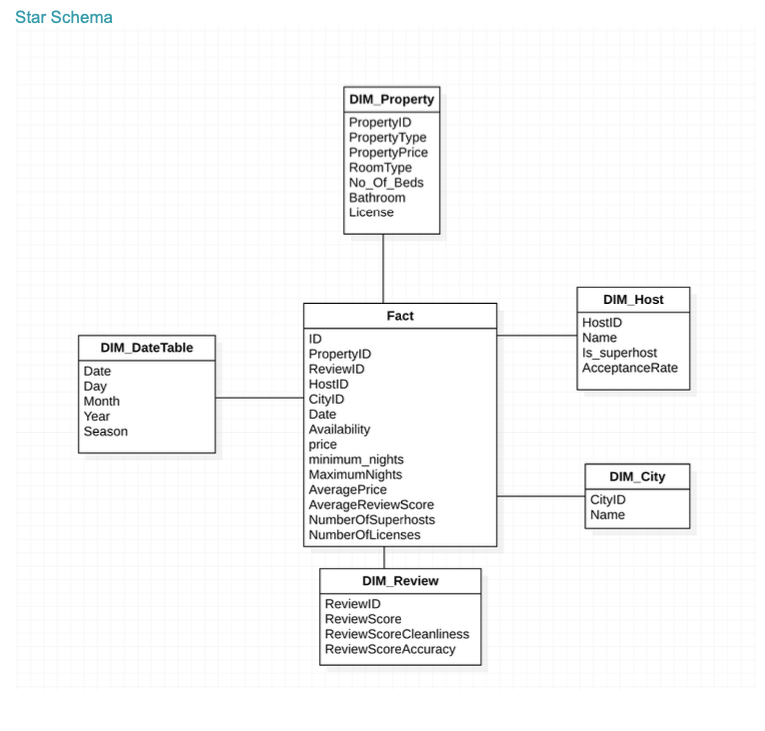
Initial data model
This star schema illustrates the data model designed for the Airbnb project, centralizing key facts around listing availability and pricing, and linking to relevant dimensions like property details, host information, city, and date.
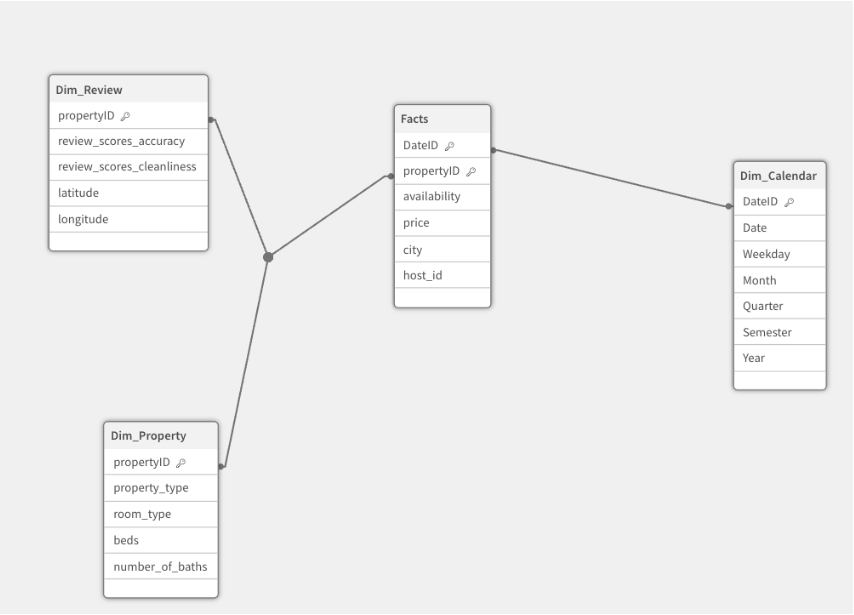
Refactored data model
This star schema illustrates the data model designed for the Airbnb project, centralizing key facts around rental prices according to the cities, rental prices by months, prices according to the type of property and property distribution by cities
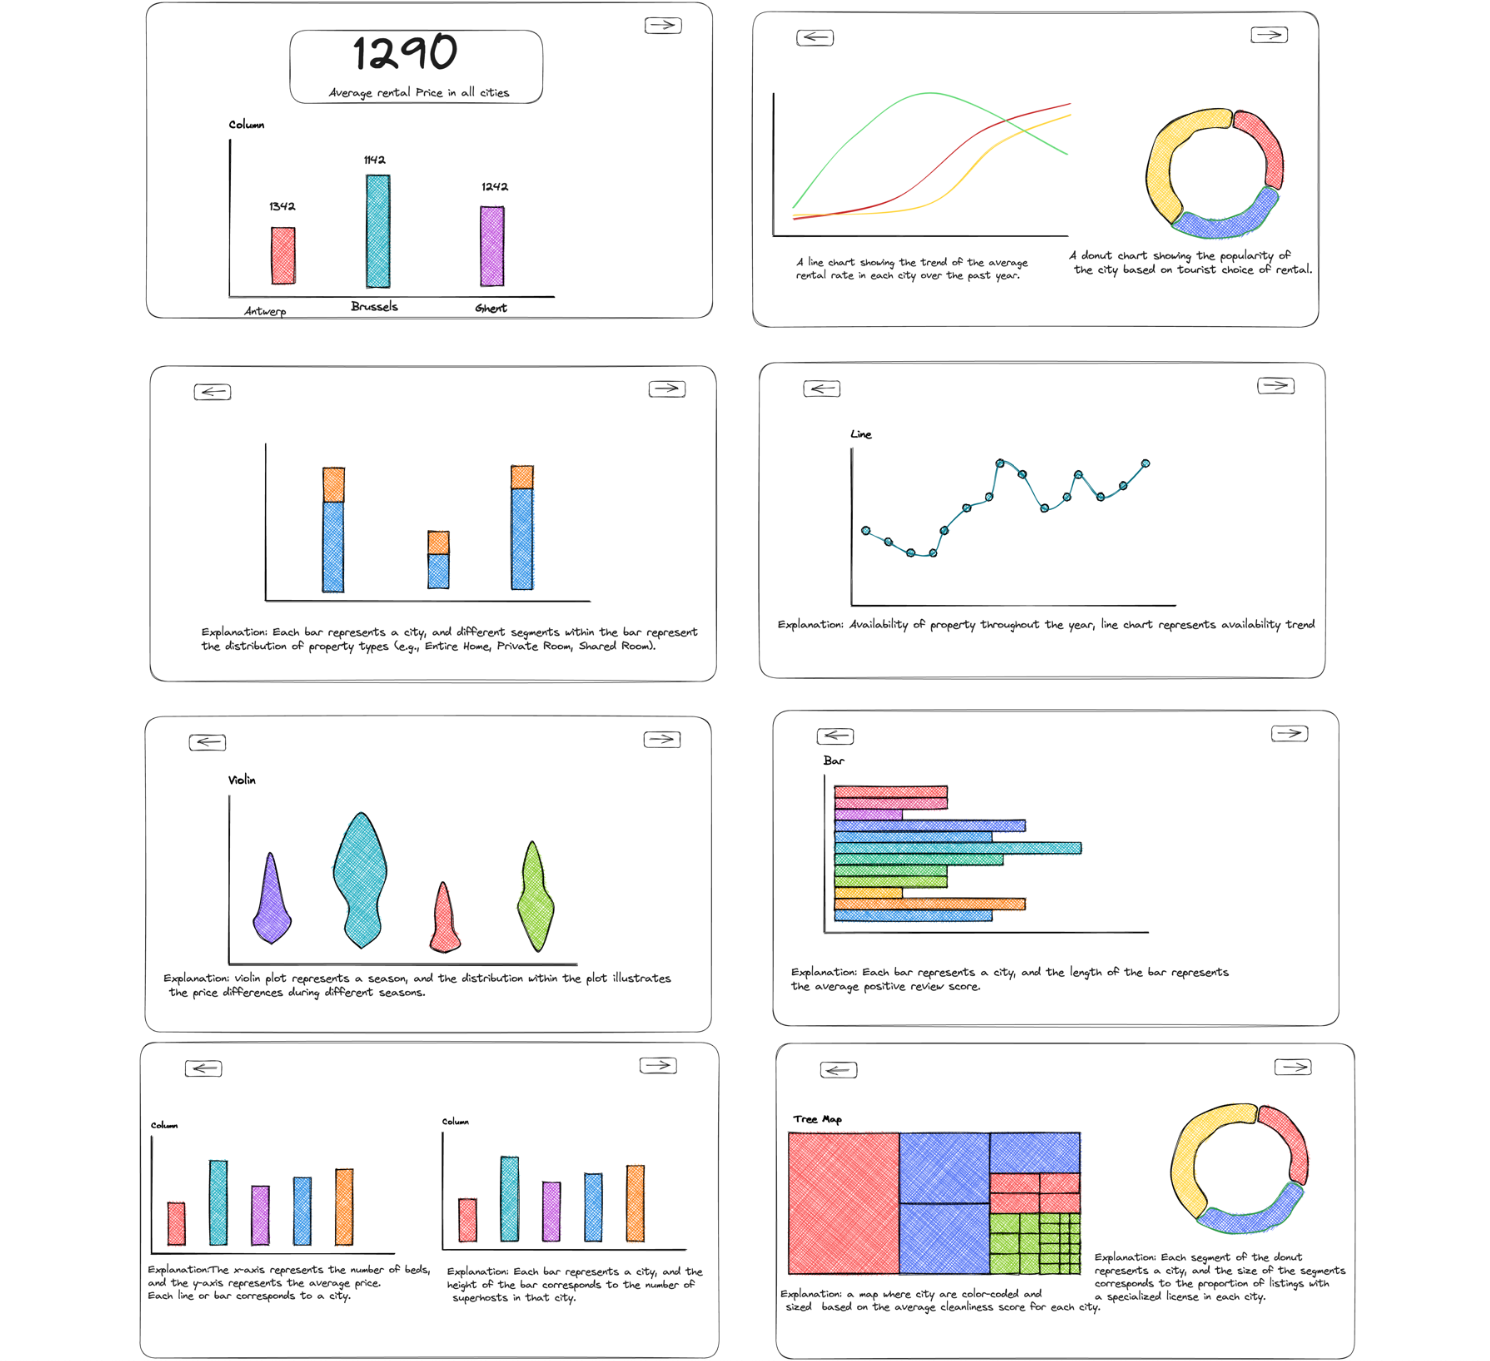
Prototype for catering to initial data model
These prototype visualizations from made in excalidraw was to demonstrate the various types of charts designed to answer key project questions and provide insights into Airbnb data. This was subject to change as the final dashboard was as shown below
Web Application Overview: From ETL to Interactive Data Journalism with Qlik Sense
This web application is basically the data journalism part of our bigger data analytics project. What it does is take all that raw data and the cool stuff found in our dashboards and turn it into easy-to-understand stories. Different kinds of journalistic writing was used to do this, and we've got visualizations built right in to help make everything super clear.
This is built simply with HTML, CSS, and plain old JavaScript. For the visuals, we've hooked it up with Qlik Sense web integrations. This means the charts and graphs aren't just pretty pictures; they're interactive and responsive. So, for example, if you're a tourist, you can play around with the data, pick out specific properties, and get a quick idea of what you might be paying. It's all about making the data tell its story directly to you.
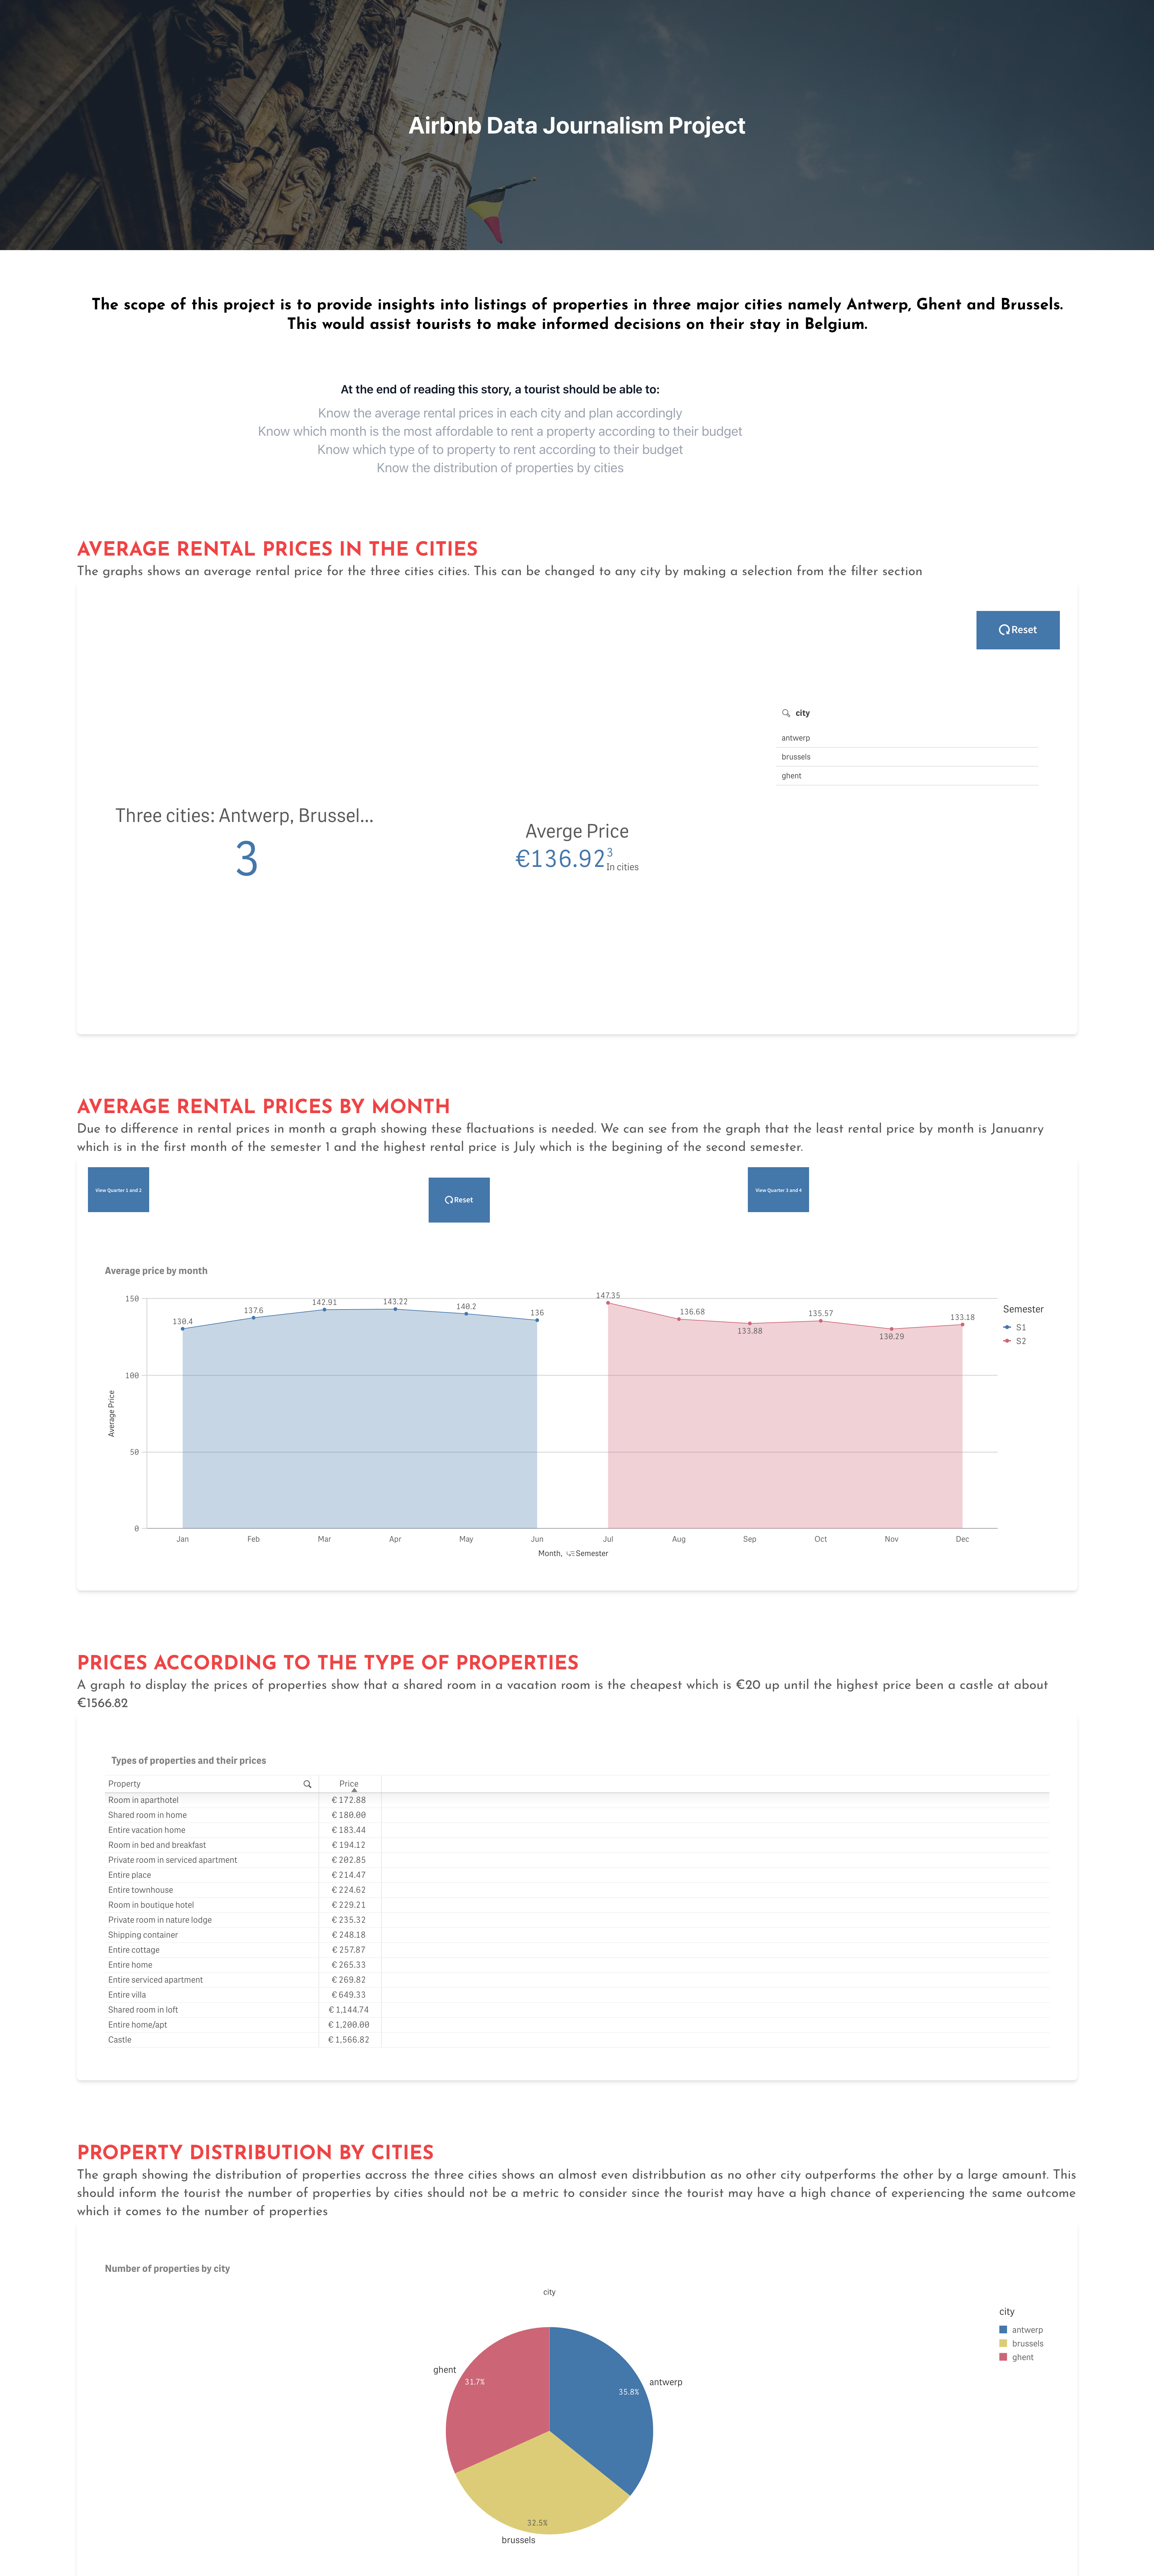
The final frontend webpage integrates the Qlik Sense dashboards into a user-friendly interface, presenting key insights from the Airbnb data in a data journalism format.
Reflection on What I Learned During the Project
This project provided invaluable hands-on experience in developing a complete business intelligence solution from raw data to a user-facing web application. I gained a deeper understanding of working with real-world, often messy, data and the importance of data cleaning and transformation (ETL/ELT). The process of defining clear project requirements and creating a robust data model through a star schema was crucial for effective analysis.
Collaborating with a stakeholder for design and data model validation underscored the importance of external feedback in ensuring a solution meets user needs. Specifically, working with an Epic data employee during the project development stage to receive feedback was instrumental in refining the design and ensuring the data model accurately reflected their operational insights and reporting requirements.
Furthermore, integrating the Qlik Sense dashboards into a simple HTML/CSS frontend taught me about the practical aspects of deploying data visualizations and making them accessible through a web interface, ultimately building an end-to-end solution.