WaterWatchers: A Water Level Monitoring Solution for Flanders
This project addresses the critical issue of decentralized and un-normalized water level data in Flanders, which hinders effective flood management. The solution is a comprehensive system that collects data from sources like waterinfo.be and custom sensors, normalizes it using OSLO standards, and stores it in a centralized PostgreSQL database. The primary output is a Grafana dashboard, accessible via a web application, which provides local governments with clear visualizations to enable swifter, more accurate decisions for flood prevention.
This project, undertaken by Team A1: Code Craftsmen for the academic year 2023-2024 at Campus Geel, aimed to provide a comprehensive solution for monitoring water levels in Flanders. The overall goal was to gather, normalize, and visualize water level data to empower local governments. The product owner for the project was Cipal Schaubroeck, an IT, payroll, and HR services company active in the public sector, whose mission is to drive digital transformation for smart cities.
Problem
Flanders faces an increasing risk of floods due to various factors, including global warming. A significant challenge is that existing data regarding second-degree watercourses is decentralized and not normalized. Furthermore, communication between different involved parties during flood-related crisis situations is difficult and slow, which negatively impacts their decision-making speed and accuracy. Interactions between infrastructures are also not always clear, and the impact of decisions or measures is often unclear.
Objective
The primary objective of this assignment was to provide provinces in Flanders with a dashboard that displays information about watercourses of the second grade. This platform would allow local governments to more accurately track water levels, enabling them to make swifter and more accurate decisions regarding flood prevention and management.
Retrieving data from existing sources like waterinfo.be and potentially MyCSN
Onboarding and integrating new sensors
Normalizing all data and centralizing it in a dedicated database
Creating a dashboard
Ideally, the dashboard should also be reachable through MyCSN if platform access is provided
Set up infrastructure to collect necessary data about second-grade water streams from various sources
Store this data in a normalized format according to OSLO standards
Create a dashboard that visualizes the retrieved data, designed to be logically structured and easy to understand for non-technical end users
Should Have
Display dashboard graphs in a user-friendly front-end application to increase accessibility for a larger number of end users
Provide options to add new sensors to the database
Allow for manual insertion of measurements for any available sensor
Could Have
SMS Alert
A Desktop Web App
A Mobile App
Out-of-Scope (Won't Have)
Prediction of water levels at certain locations based on actions or events, although this is considered the ultimate goal for the product, it was beyond the scope of this project.
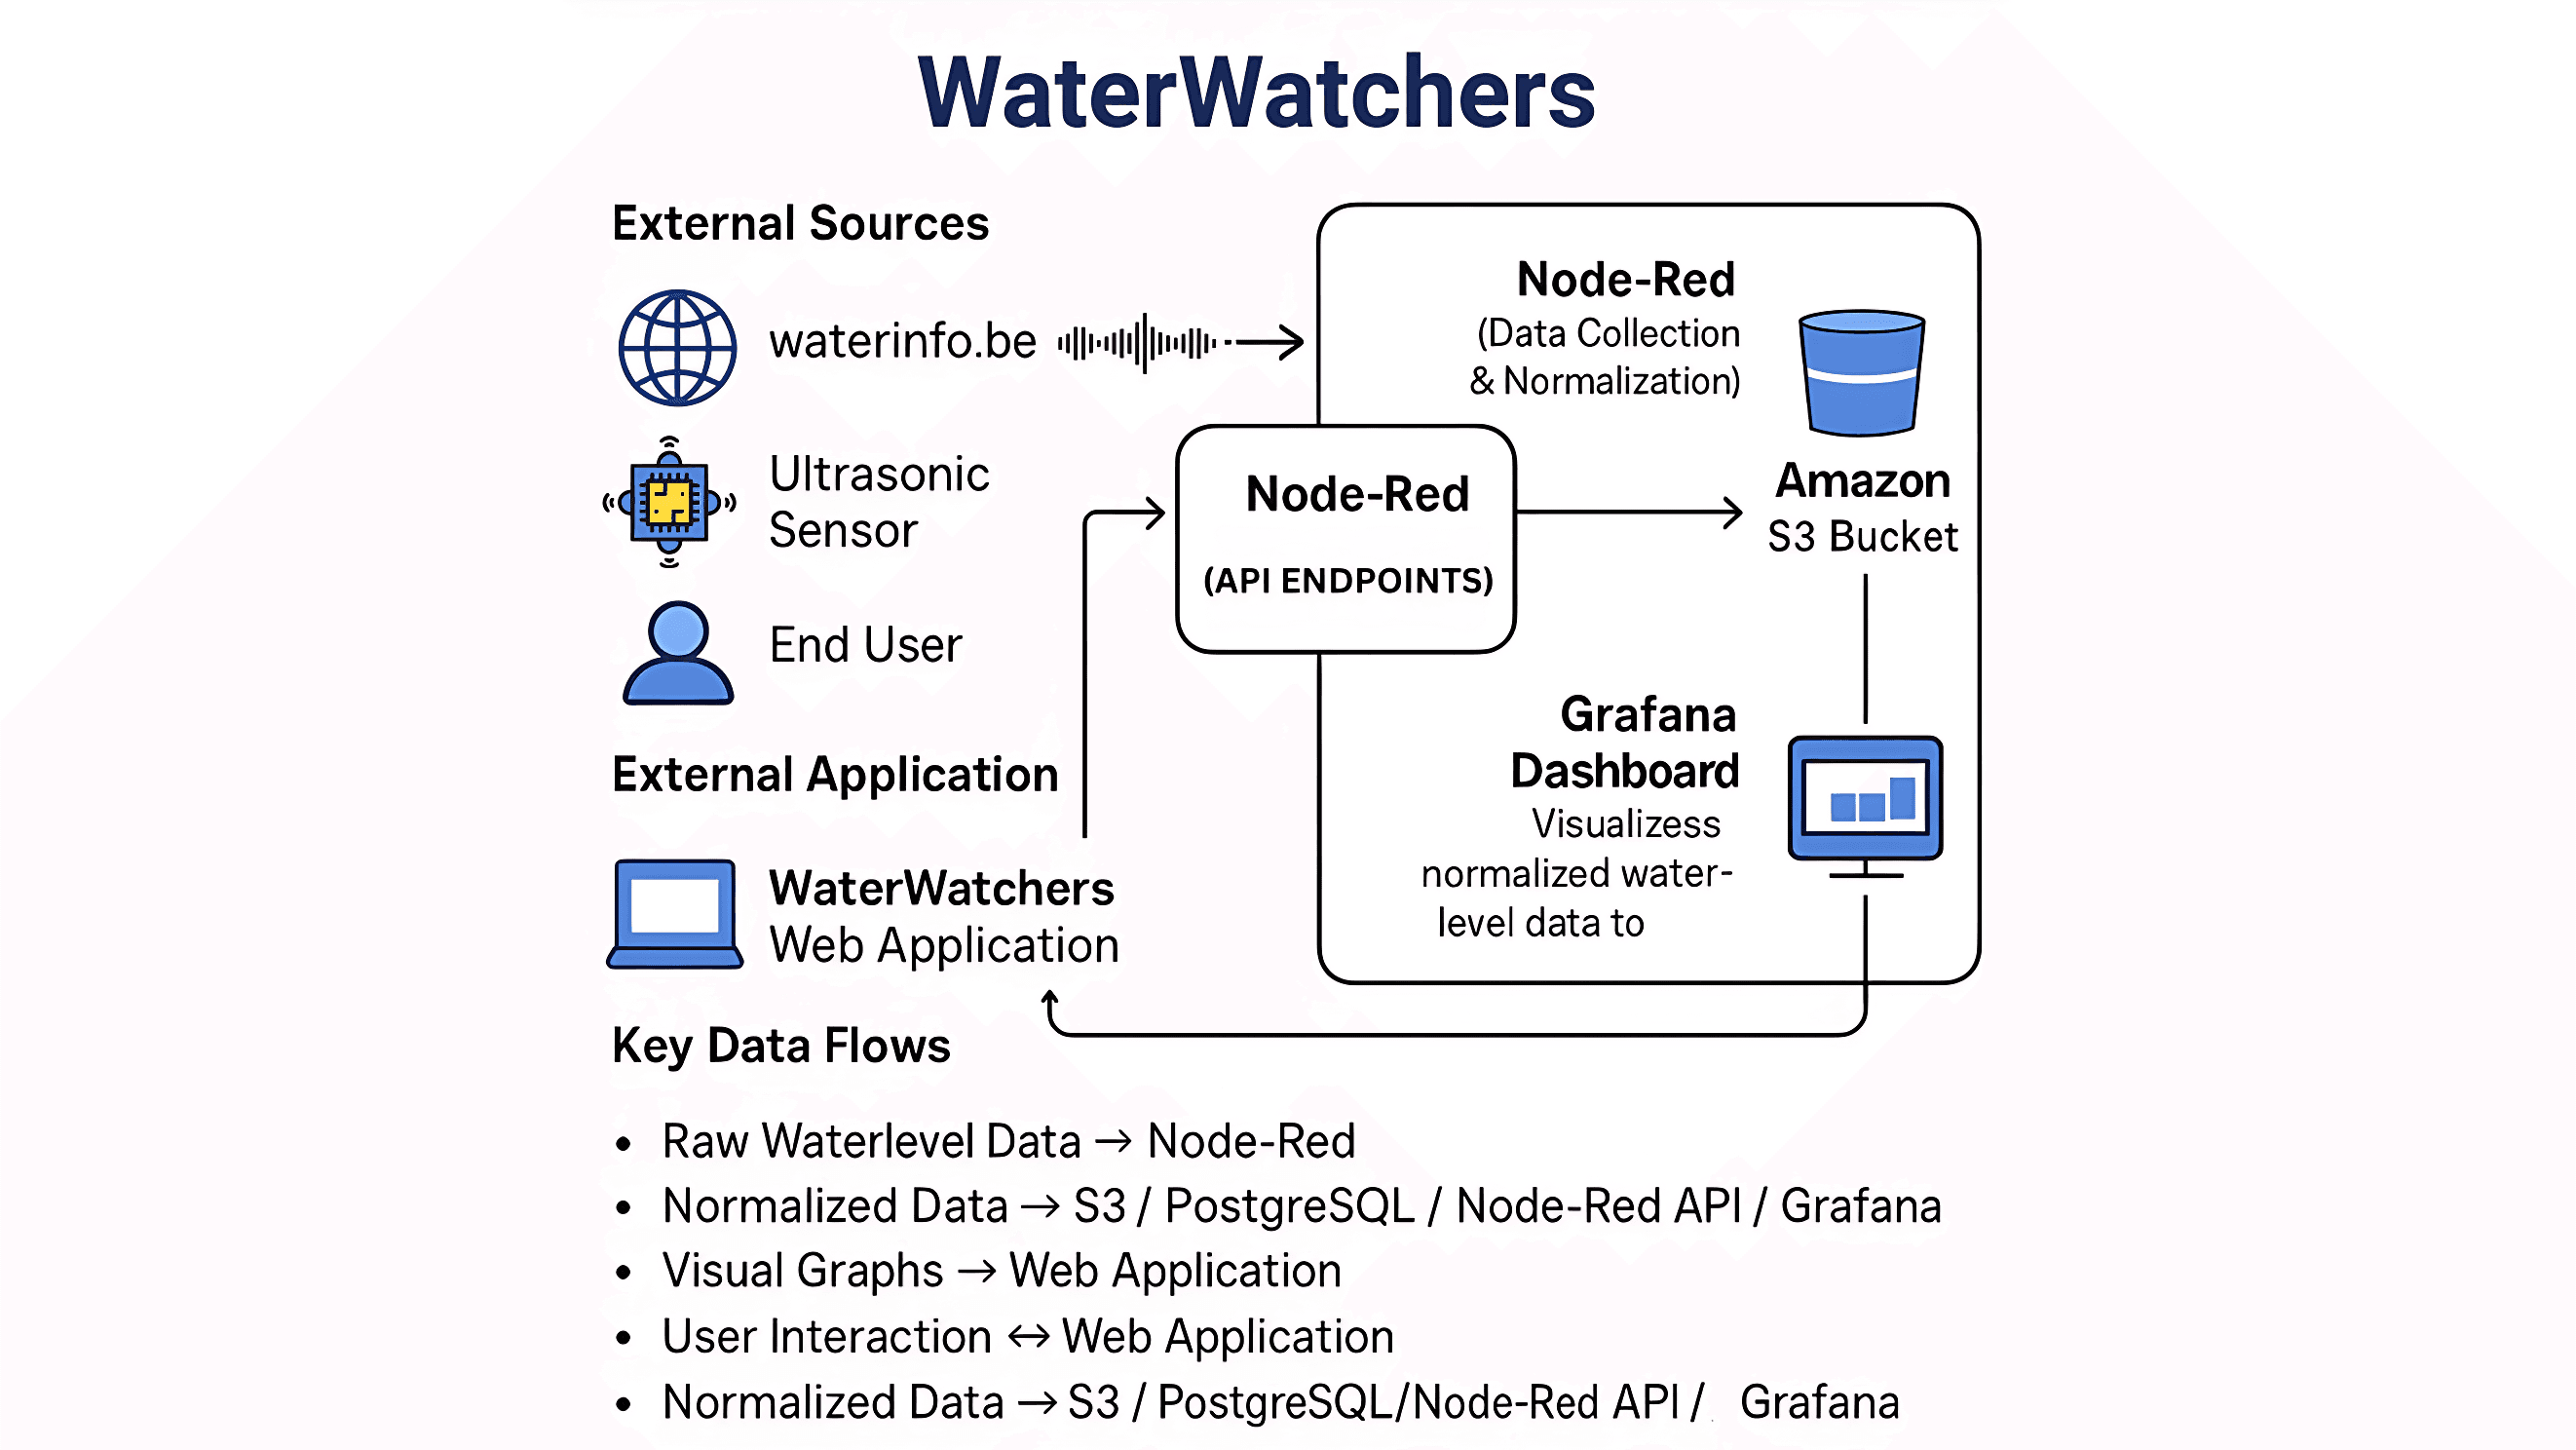
Key Features and Components
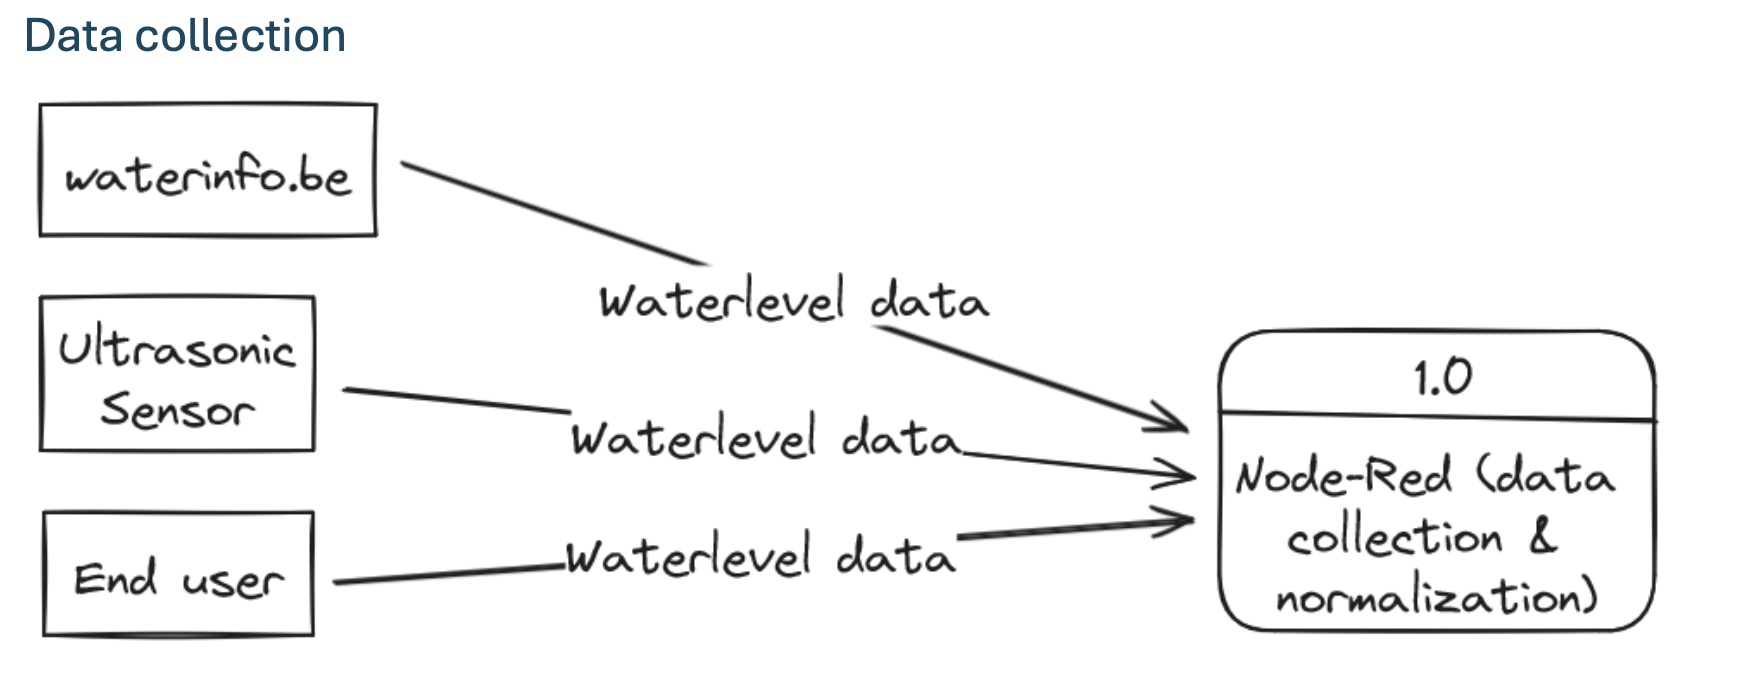
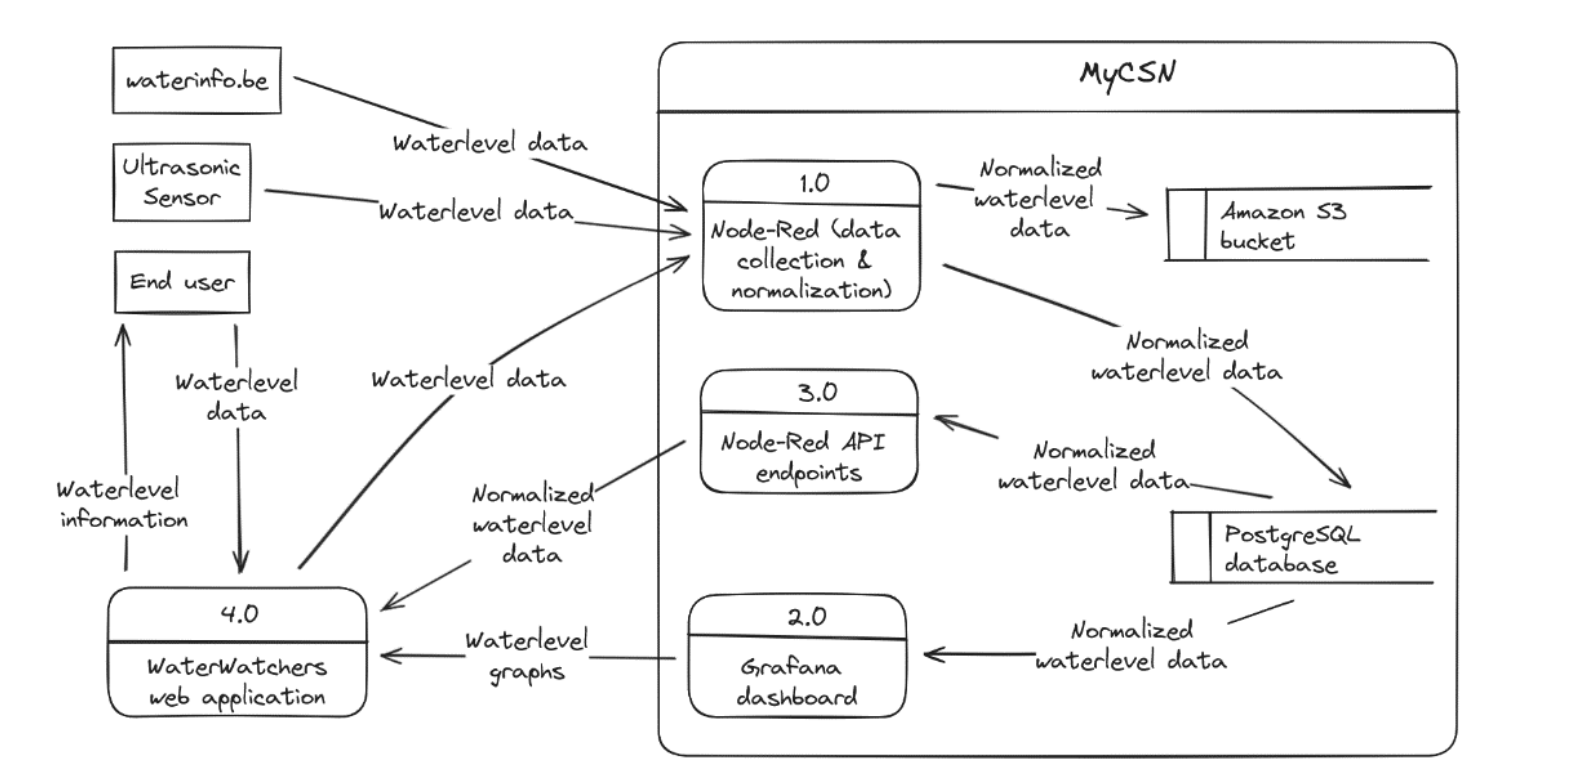
Data Collection
Data is collected from three main sources: waterinfo.be (via API calls), ultrasonic sensors (via MQTT connection), and manual input from end users through the web application. Node-Red was used as the backend to set up data collection functionalities, combining these diverse data sources.
Image showing the Data collection
Data Normalization
The OSLO (Open Standaard voor Linkende Organisaties) normalization method, using the JSON-LD format, is employed for standardizing data. This normalization is performed using functions in plain JavaScript inside Node-Red and a predefined application profile for waterbodies. Additionally, the pyld Python library, with its normalize() method, is used to support JSON-LD processing with options for URDNA2015 or JSON-LD-API algorithms.
Data Storage
The normalized data is stored in a PostgreSQL database. The normalized data is also sent to an Amazon S3 bucket in JSON-LD format for dual-storage. A relational database was chosen because Grafana requires an SQL database and the team had more experience with them.
Image of the data flow
Data Visualisation
The project uses Grafana to create visualizations in a dashboard for end users. These visualizations are updated with fresh data every twenty minutes. The web application embeds Grafana graphs using iframes and Grafana's API.
User Interaction
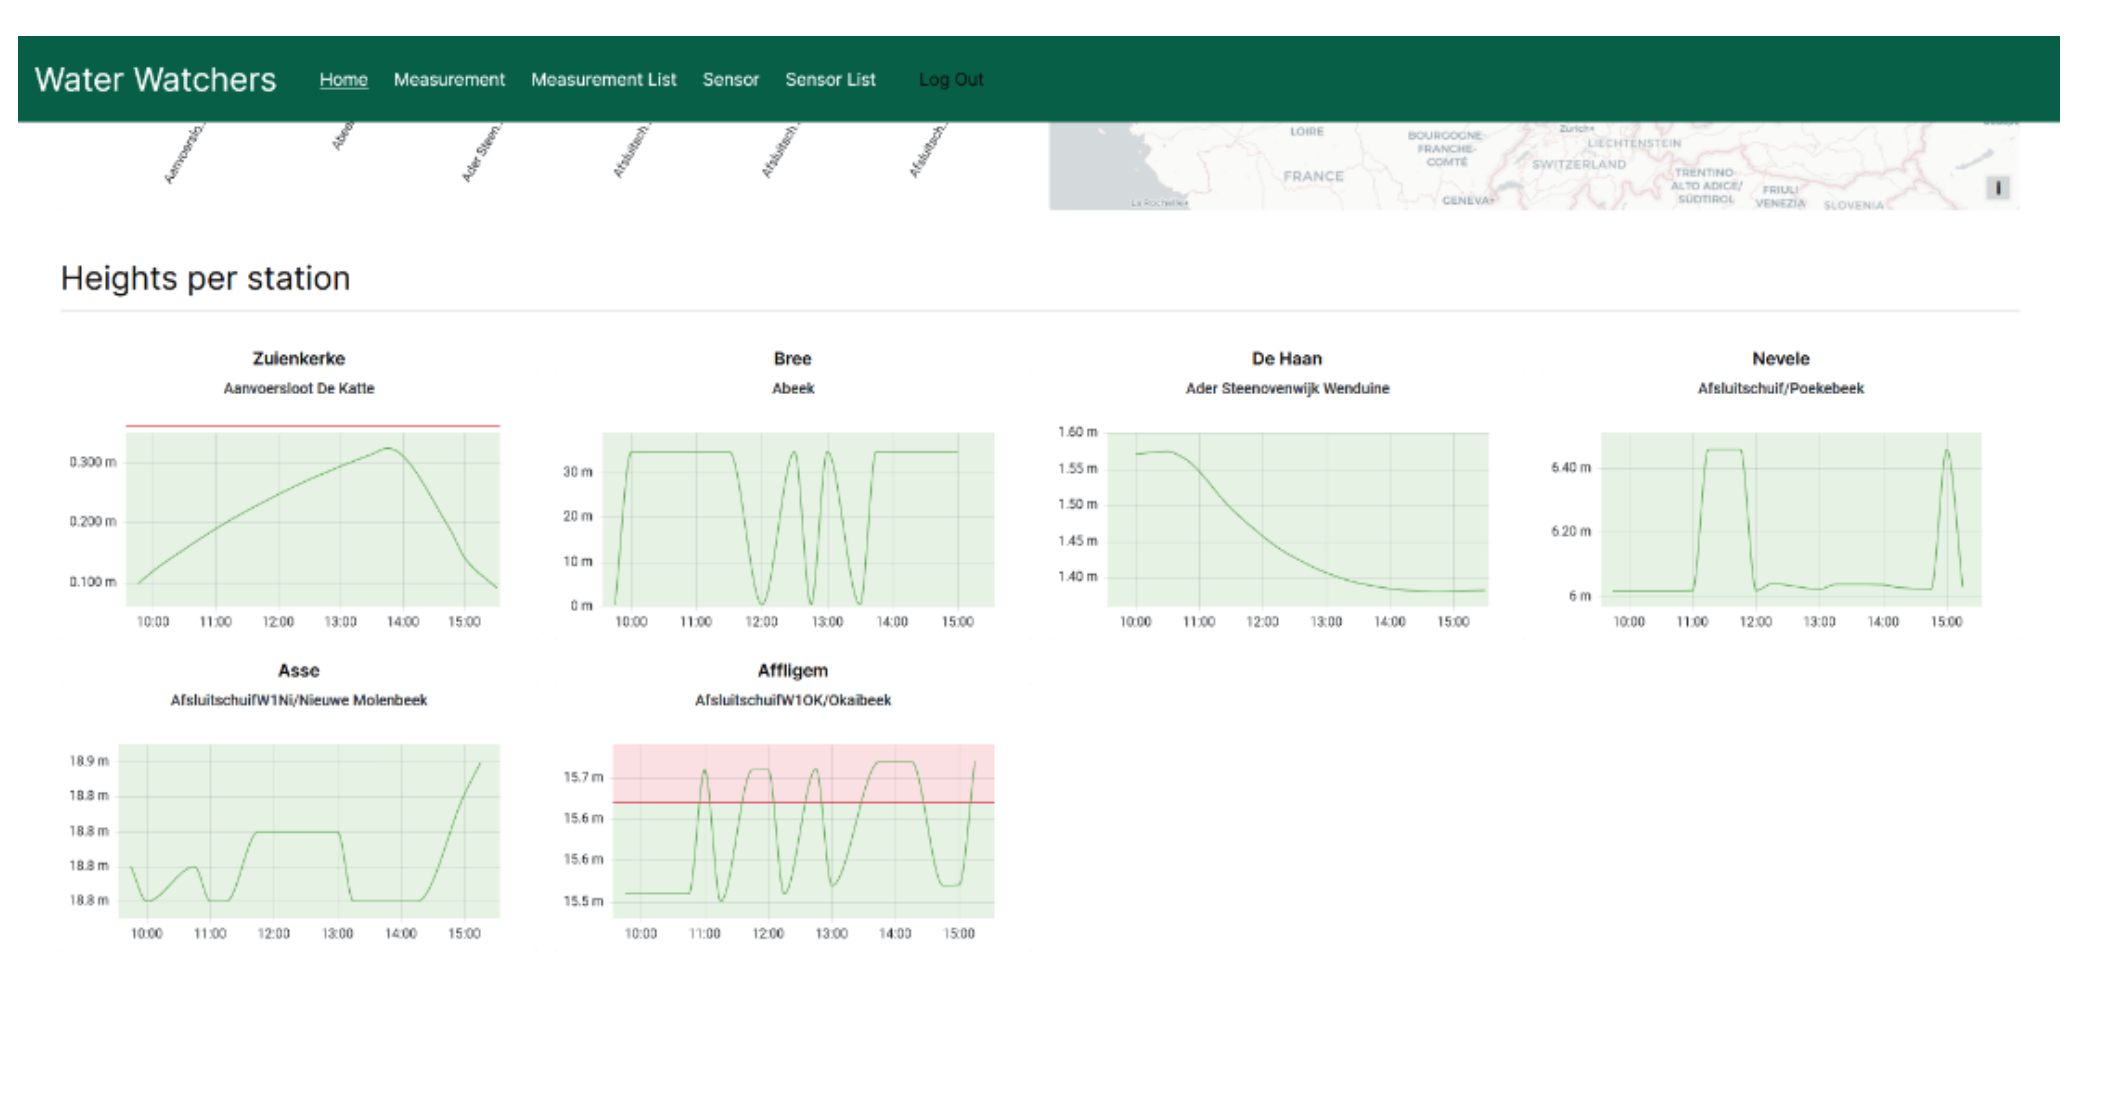
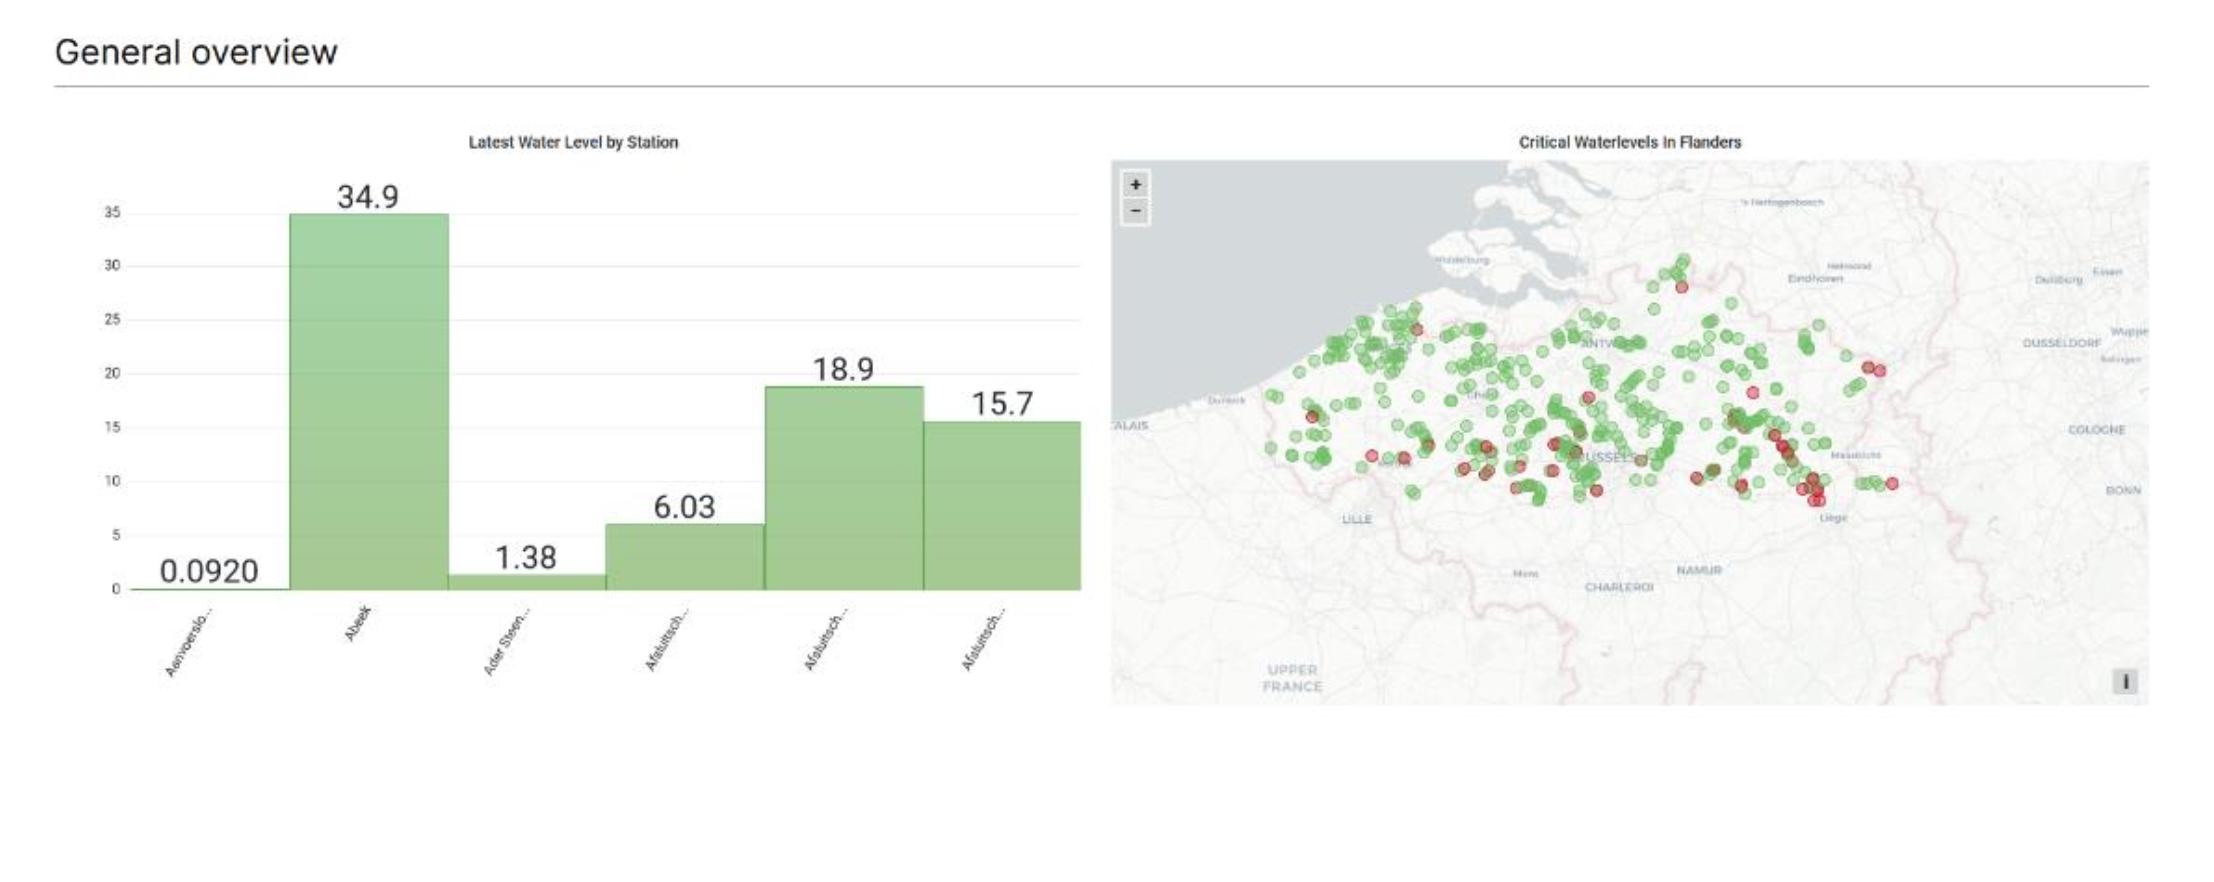
A NextJS web application provides users with easy access to existing data and graphs. This dashboard includes a homepage with a bar graph and a map graph, as well as individual graphs for each location. Users can add images of their sensor setups and subscribe to locations to receive push notifications when water levels exceed preset levels.
Image showing the Grafana graphs are embedded into the Web App
Image showing the Grafana graphs are embedded into the Web App, with Red colors showing water level exceeding preset normal levels
Technology choices
Cloud Platform: The web application's architecture is hosted directly on AWS while the backend relies on my CSN, which is Cipals own internal tool hosted also on Amazon Web Services (AWS) for ensuring scalability, security, reliability, and performance.
Programming Language for the Data Normalizer: Python was chosen for its simplicity, extensive libraries, cross-platform compatibility, development speed, and team experience.
Database: A relational database management system (RDBMS) was preferred, and PostgreSQL was ultimately selected over MySQL and Azure SQL. This decision was based on a careful evaluation of its performance, scalability, ease of use, cost, and security.
Data Visualisation Framework
Grafana was identified as the most suitable choice after evaluating expert knowledge, documentation, free functionalities, and data transformation capabilities.
Backend/Integration (Data Flow)
Node-Red, provided by Cipal Schaubroeck, served as a versatile backend tool for setting up functionalities, combining data sources, transforming data retrieved via API calls, and handling MQTT connections.
Frontend Framework
NextJS (a React-based framework) was chosen for the front-end due to team familiarity with React and NextJS's additional built-in functionalities.
Microcontroller
An ESP32 microcontroller was used for the DIY sensor due to its support for Wi-Fi and Bluetooth, and good integration with the Arduino framework.
IoT Protocol
The MQTT protocol was used for sending data from the prototype sensor, chosen for its standard use in IoT devices, ease of implementation, and good integration with Node-Red.
IoT Sensor
Meratch NB-IoT Sensor (Initially Assigned)
The Meratch NB-IoT Sensor is a smart solution for water level monitoring, certified by Deutsche Telekom Ag and Vodafone. Key features include its reliability, seamless self-updates, optimization for multiple IoT protocols, and a secure cloud connection. This sensor is resilient during connectivity outages, boasts a built-in memory unit for diagnostics, and is robust with an IP68 ingress protection rating. Tested in extreme temperatures, it has an impressive operational lifetime of 6 years. The NB-IoT protocol it uses is a wireless protocol for low-powered IoT devices that operates in a licensed spectrum, providing a higher data rate and lower latency than LoRaWAN.
DIY Ultrasonic Sensor (Proof of Concept)
Due to difficulties in accessing data from the Meratch sensor, the team developed its own DIY sensor solution. This solution uses an ultrasonic sensor to measure the distance between the device and a surface. The sensor connects to an ESP32 Dev Kit which provides power and handles data processing. The microcontroller computes the data and sends it to an MQTT topic on Node-Red. The DIY sensor was quickly built on a breadboard for simplicity.
Architecture & Deployment
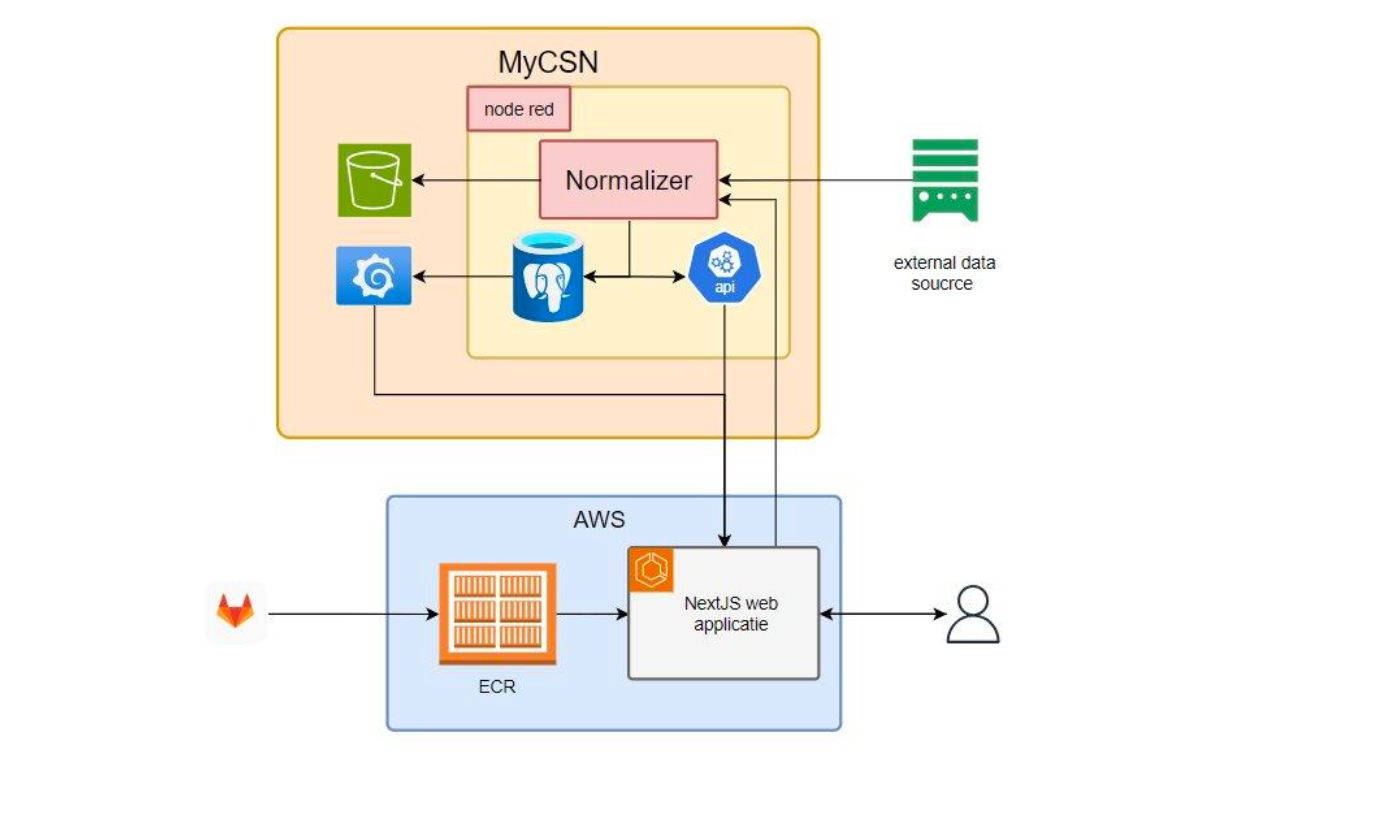
The overall system was initially designed to reside within Azure, but the web application's architecture now relies on Amazon Web Services (AWS) for hosting. The system collects data from external sources, queues it, and sends it through a data normalizer. Normalized data is then placed into a database connected to a web application container where users access a Grafana dashboard.
Image showing system architecture
Deployment was managed on Cipal's on-AWS platform for showcasing the project. GitLab was used for its CI/CD pipelines, which ensured an automated deployment process. For testing purposes, Vercel was utilized, and the pipeline itself was configured to send a Discord notification upon start, validate AWS credentials, and create/push a Docker image to ECR for execution on ECS.
Project Methodology and Deliverables
The project adopted an Agile Scrum methodology with DevOps principles. It included Shared Vision and Product Backlog with requirements sliced into epics, user stories, and tasks using Trello. Sprint planning used Planning Poker for workload estimation. Sprints had a fixed length of one week with daily iterations and product increments.
Project Reflection
Technical Content: Gained experience in implementation within a broad project context. Improved ability to interpret other people's work and align with different professions. Acquired invaluable hands-on experience in developing a complete disaster monitoring solution from raw data to a user-facing web application. Deepened understanding of working with real-world data and the importance of data cleaning and transformation.
Soft Skills Evolution: Developed the ability to quickly delegate work and resolve each other's problems. Improved skills in providing and receiving feedback on others' work. Emphasized openness and communication within the team and how to maintain professionalism. Collaboration with a stakeholder for design and data model validation underscored the importance of external feedback.
In the Node-Red backend, SQL prepared statements are used to prevent SQL injection attacks. These statements predefine the structure and data types of the data before execution.
Benefits for stakeholders
By using this product, local governments in Flanders will gain a more accurate and swift way to analyze water levels of second-grade water streams. This will lead to:
Quicker and better decision-making
Facilitate the implementation of measures against water level problems
A centralized source of data, reducing the need for extensive personal communication
Improved accuracy and speed of decisions regarding water level management