Real-World Brazil E-Commerce Data Lakehouse: Production-Grade Engineering on Azure Databricks
Built a production-ready medallion architecture data lakehouse on Azure Databricks that transforms 100,000+ raw e-commerce records into business-ready analytics. Demonstrates real-world data engineering challenges including data relationship complexity, incremental processing, and cost-effective cloud architecture—all delivered on a student budget with enterprise-quality patterns.
From Messy CSVs to Governed Analytics Platform - A Real-World Data Engineering Journey
I built this project to answer a deceptively simple question: "Can I create a production grade data platform that actually works reliably without breaking the bank?" What started as nine messy CSV files became a story of engineering pivots, hard learned lessons, and ultimately, a robust lakehouse that powers real business insights. This is the story of how I went from a broken data splitting strategy to a governed, incremental platform that just works.
Project Overview & Goal
The Mission: Build a modular, reproducible ELT pipeline on Azure Databricks following the Medallion Architecture that can handle both historical backfills and true incremental processing—all while staying within student budget constraints.
The Challenge: Transform nine interconnected CSV files from the Brazilian E-Commerce (Olist) dataset into a governed lakehouse that delivers trustworthy analytics and business-ready insights using only native Databricks tools.
The Outcome: A lean, intelligent pipeline that processes years of historical data in one run and handles new monthly data in minutes, powered by a simple control-table pattern that makes everything idempotent.
This project balances practicality (cost, simplicity) with professional patterns (governance, reproducibility) to produce trustworthy analytics.
Azure Infrastructure Setup
Resource Architecture: Built a cost-effective yet scalable cloud infrastructure:
Azure Databricks Workspace: Created in the same region as storage for optimal performance and reduced egress costs
ADLS Gen2 Storage Account: Enabled hierarchical namespace for better file organization and performance
Access Connector for Azure Databricks: Configured managed identity-based authentication to eliminate credential management
Storage Permissions: Assigned Storage Blob Data Contributor role to the Access Connector for seamless data access
Unity Catalog Metastore: Centralized metadata management attached to workspace for governance
Single-Node Cluster: Cost-optimized configuration with aggressive auto-termination (15-20 minutes) to control student budget
Smart Cost Controls:
All resources in same region to minimize data transfer costs
Single-node cluster sufficient for this data volume
Master job that sequences Bronze → Silver → Gold with visible dependencies reinforcing the "no step runs unless the prior succeeded" design
The Story Arc: From Raw Files to Reliable Insights
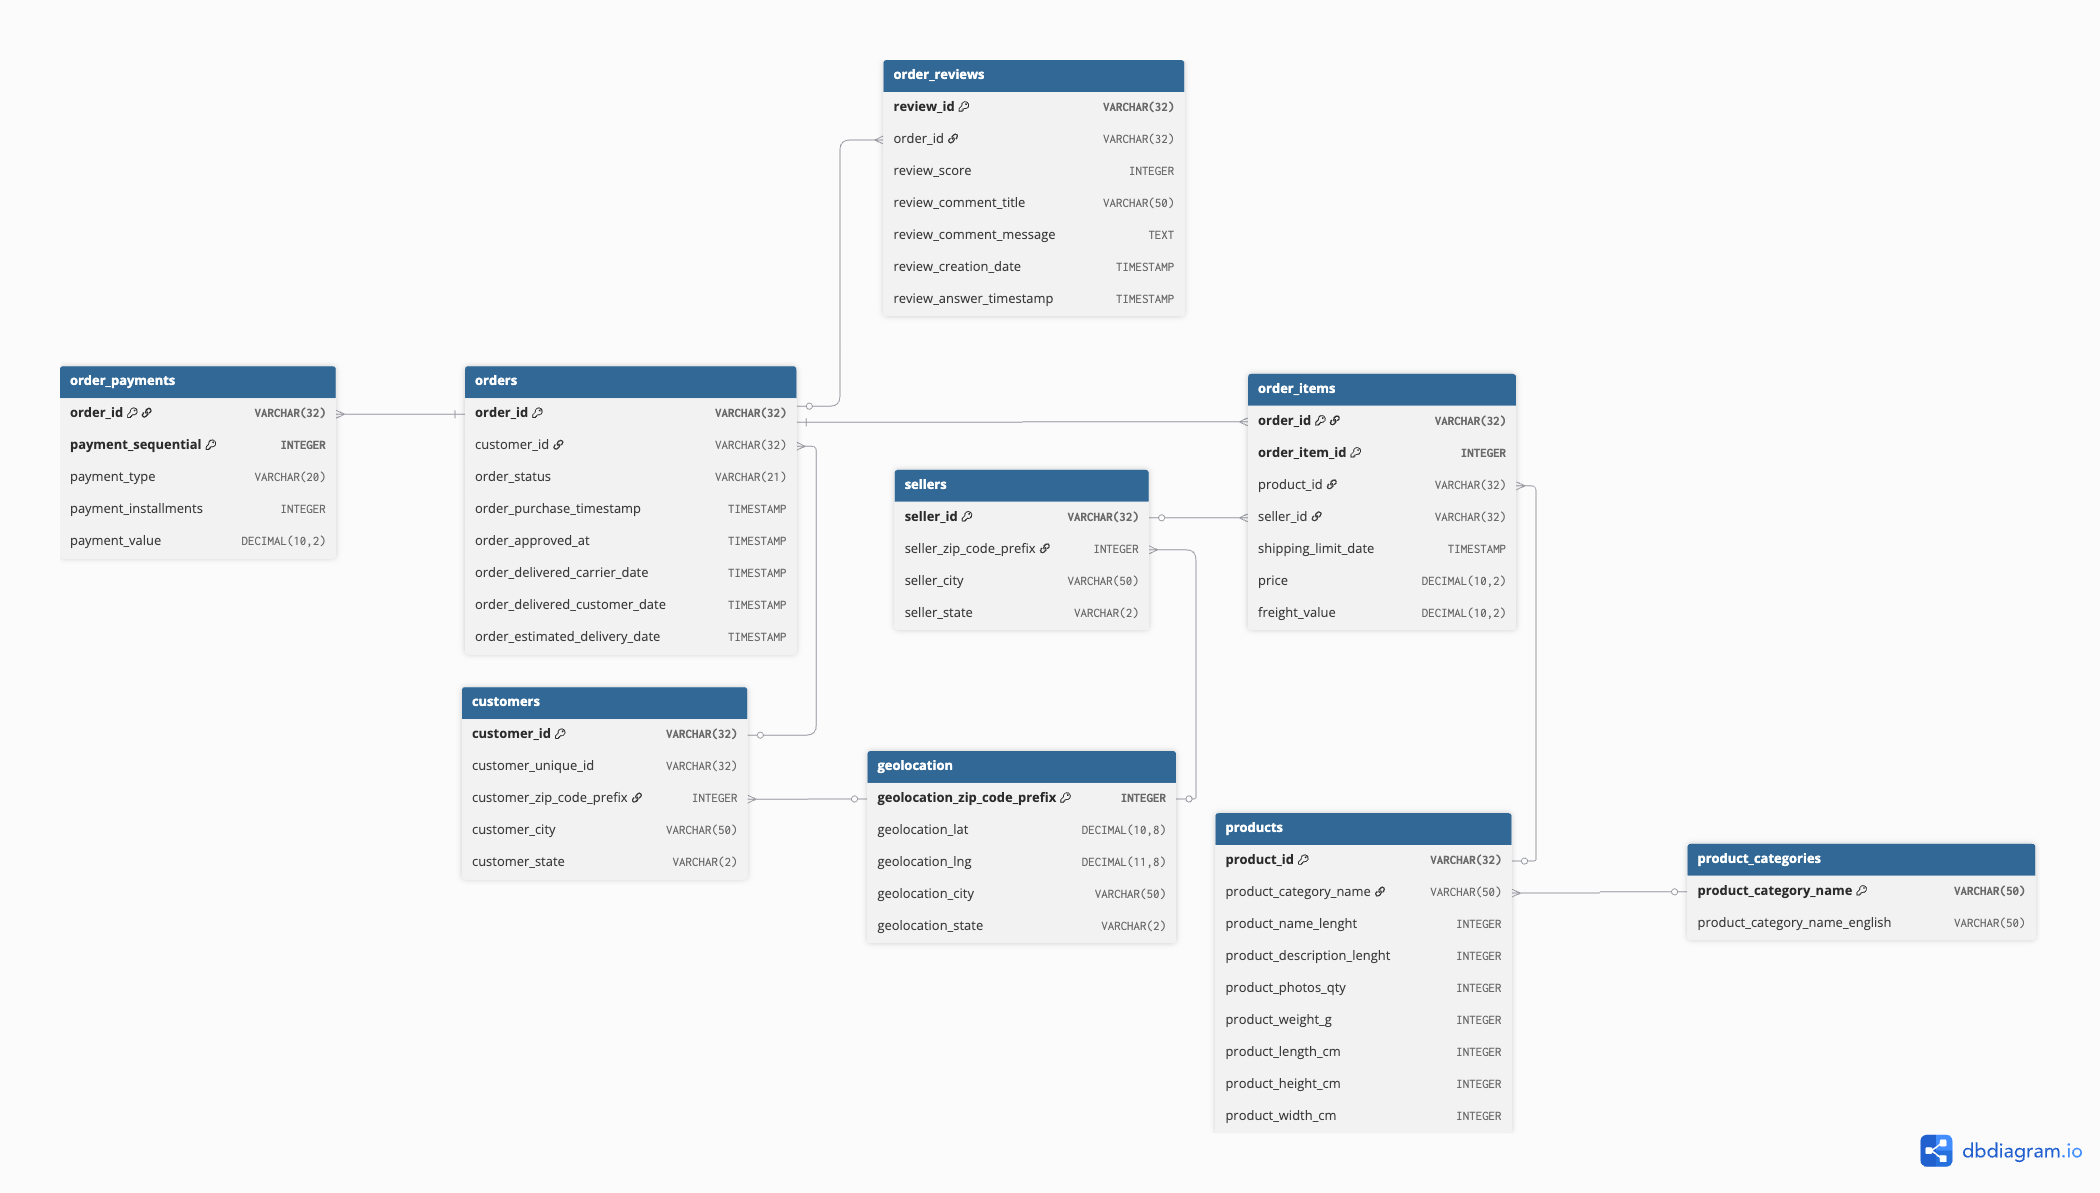
I discovered the Olist dataset nine(9) CSVs with 100,000+ e-commerce orders that didn't quite align with a standard star schema. Before writing a single line of ETL, I spent time in dbdiagram.io, sketching relationships and validating connections across tables. This upfront investment in understanding the data would save me from a painful mistake later.
Early draft in dbdiagram that helped expose relationships and grain before committing to code
The source data came organized in a complex nested structure that would later inspire my control table approach:
Source folders organized by year/month that inspired the control-table approach
The First Mistake
Confident in my approach, I built automated splitting logic to divide the data by months. I picked a "date" column from each table and let the algorithm work its magic. The results looked perfect—until I started validating.
The Problem: E-commerce events don't happen on the same timeline. Orders have order dates, but deliveries happen later, reviews come even later, and payments can be split across time. My "clever" splitting had created datasets where related records lived in different months.
The Awakening: When I checked an order from August against its payment records, they were scattered across different monthly folders. The data was telling me a story, but I wasn't listening.
The Pivot
I threw away my automated splitting and rebuilt it from the ground up. This time, I anchored everything to the master orders table timeline. Every split was validated row counts matched, relationships held, and the story was consistent.
The Lesson: Design to the truth of the data, not the convenience of the code. This decision set the tone for everything that followed: if it's not truthful, it's not useful.
The Pattern Hunt
With clean data splits, I faced another choice: monolithic notebooks that did everything, or modular notebooks with one-table-per-file. I chose modularity, and it paid off in ways I didn't expect:
Parallel execution: Independent notebooks could run simultaneously within Databricks Workflows
Easier debugging: When something broke, I knew exactly where to look
Clear ownership: Each transformation had a dedicated, focused purpose
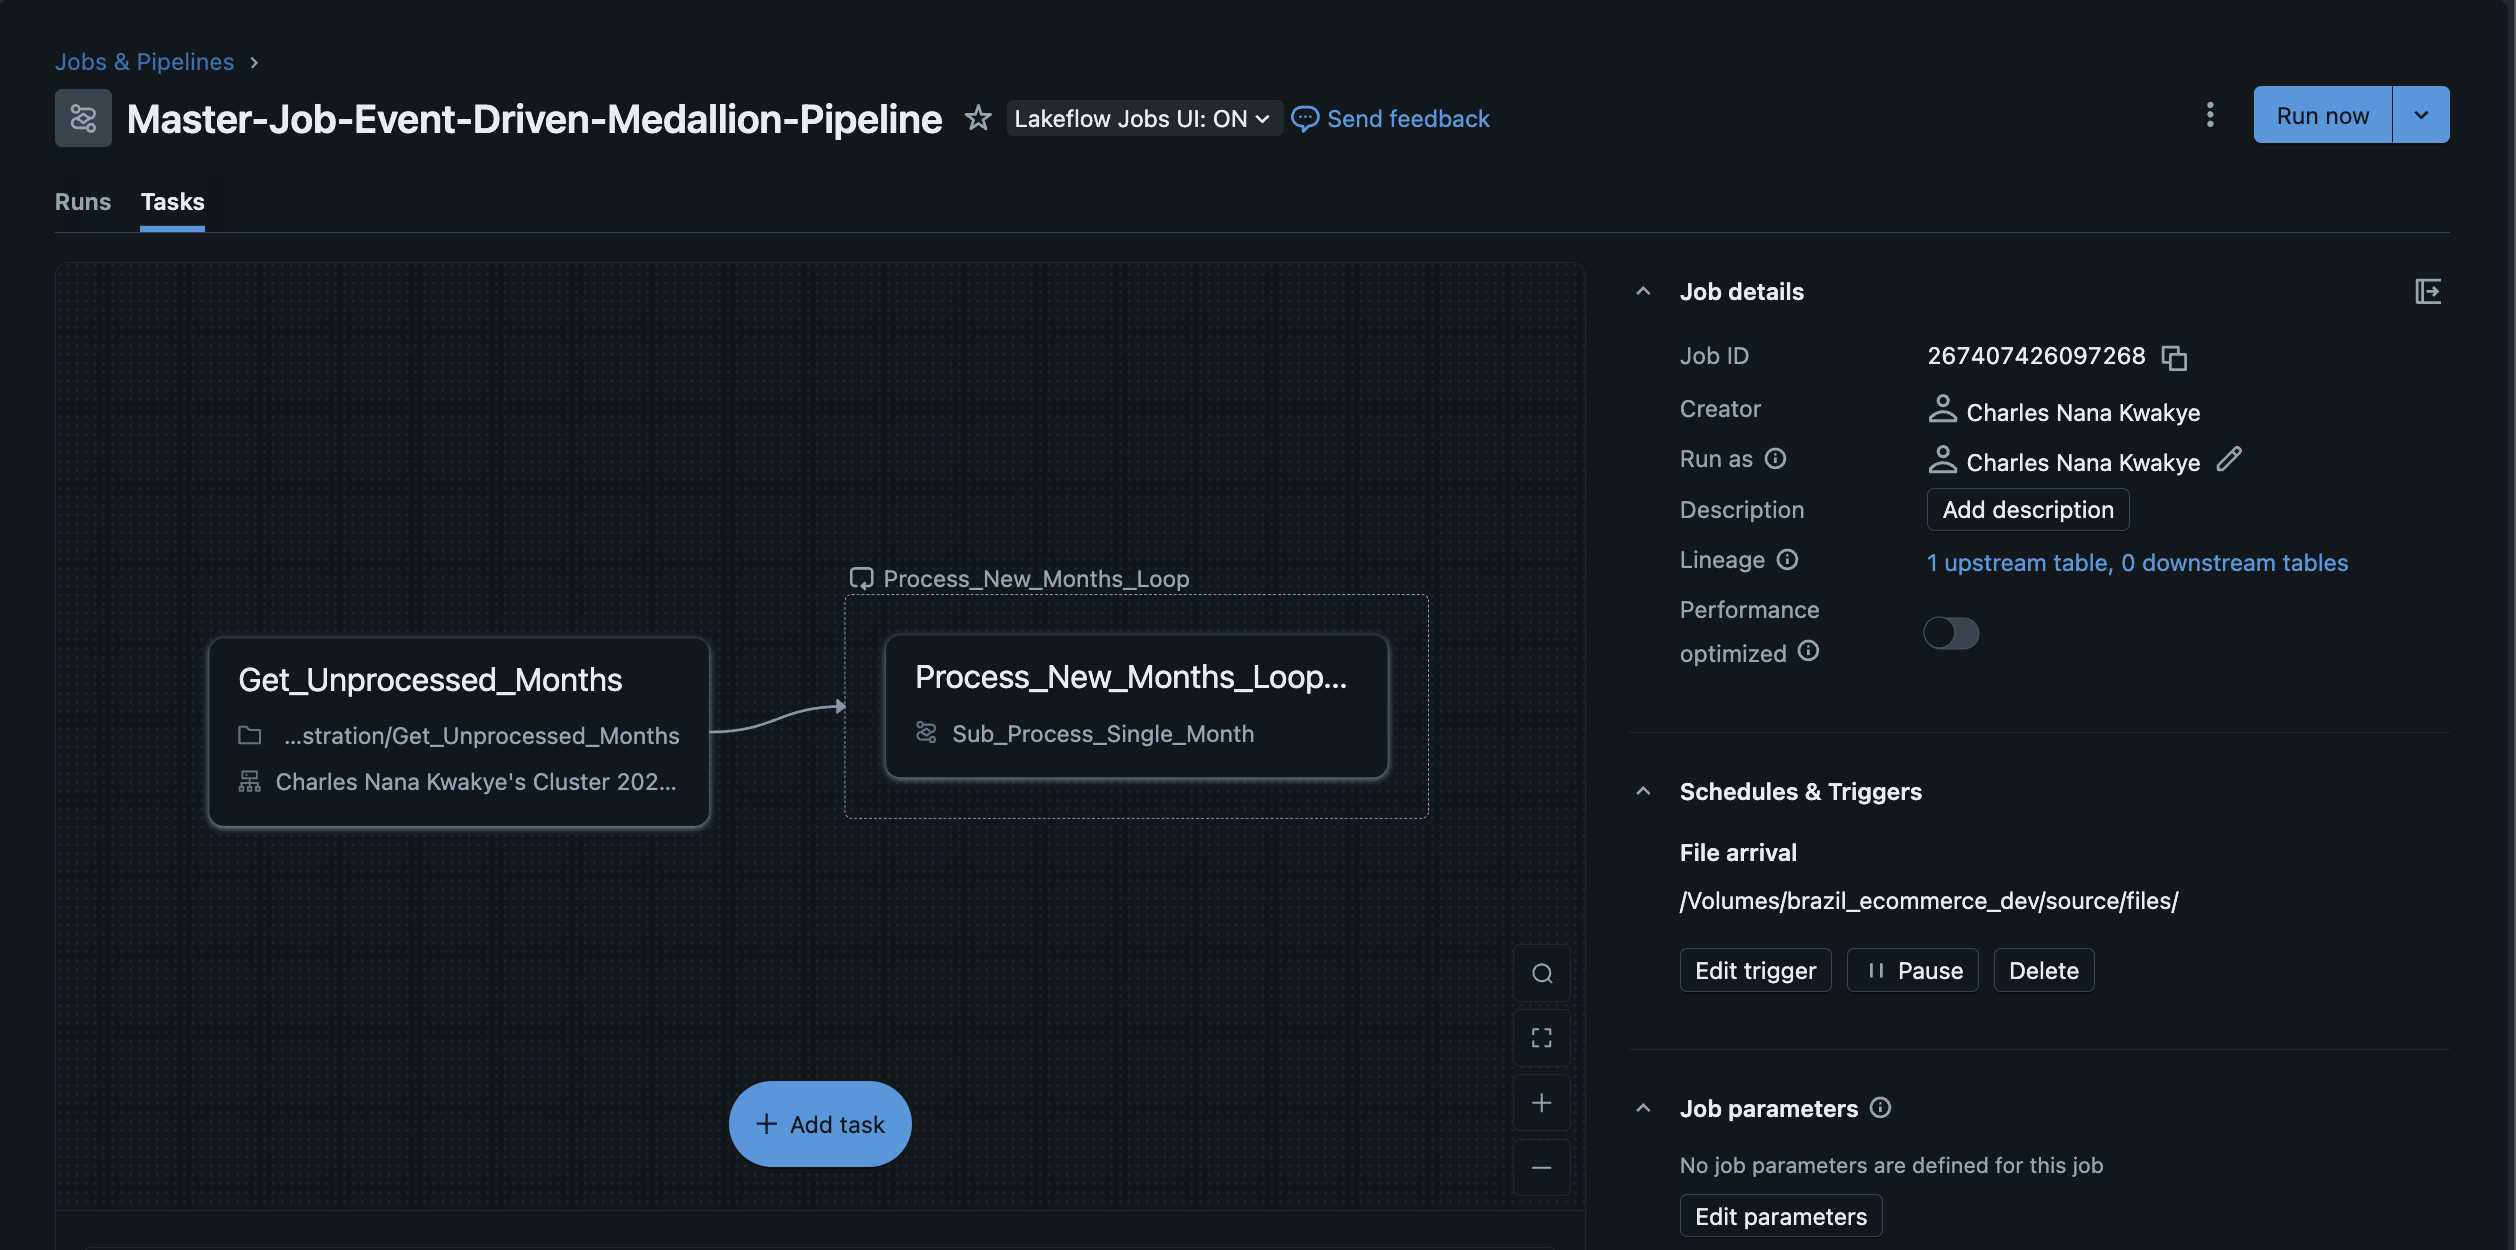
The Orchestration Evolution
My first orchestration attempt felt clever: two separate workflows, one for historical data and one for incremental loads. It worked, but it was brittle and hid complexity in people's heads.
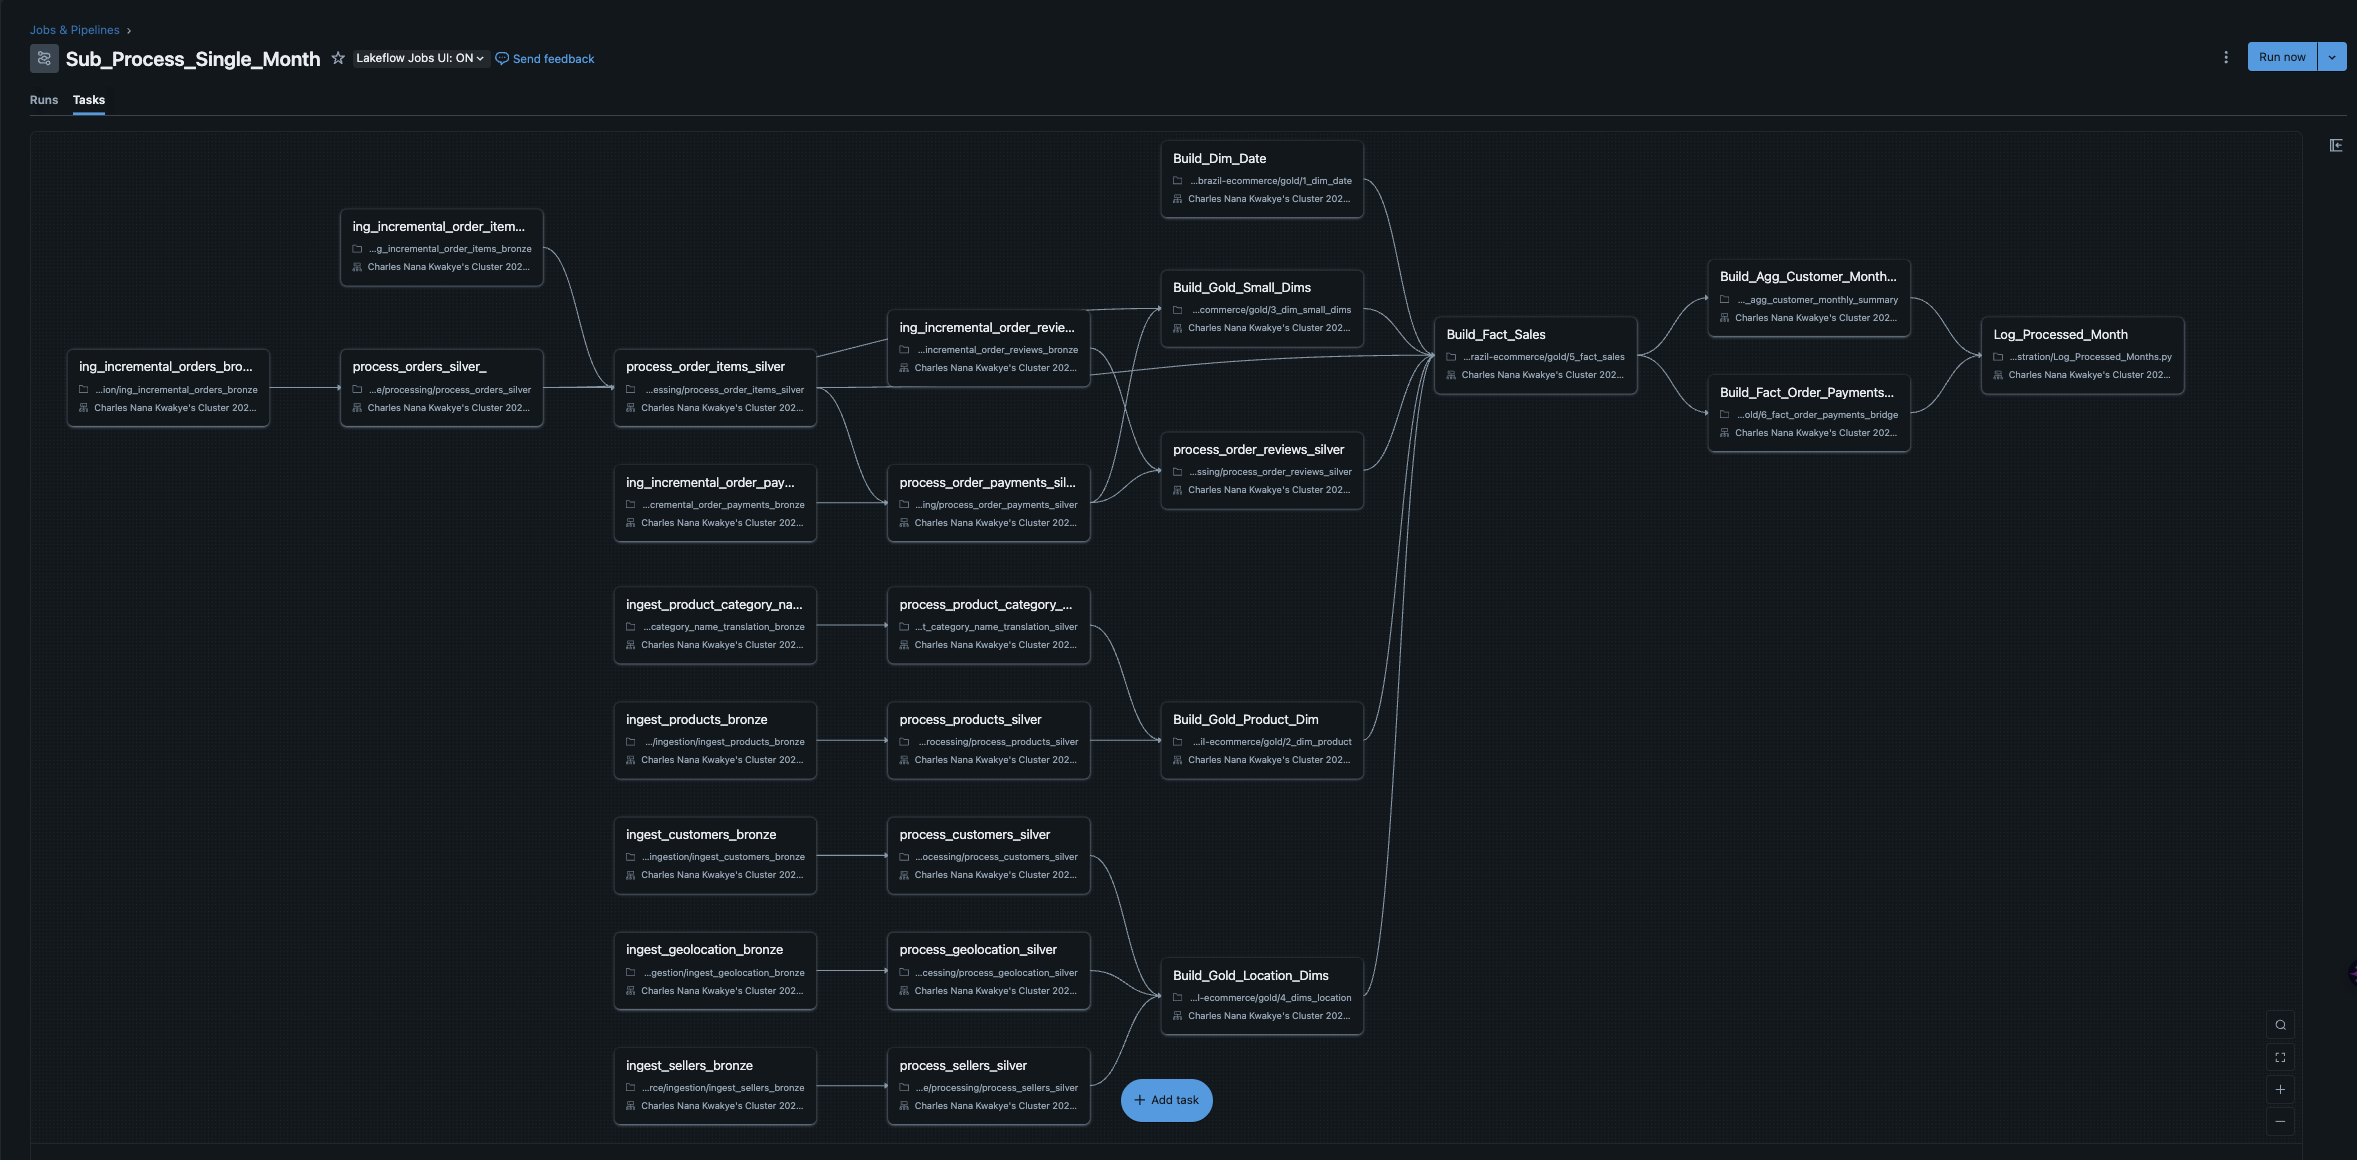
Master/sub-job orchestration from the earlier, more complex version
Parameterized tasks passing month context that informed the eventual control-table design
The Simplicity Win: I replaced both orchestrators with a single, stateful loop using a tiny control table within Databricks Workflows. The logic was beautifully simple:
Discover available months in source
Check what's already been processed
Process only the new months
Log success for next time
Simple, testable, and transparent.
The Payoff
With a stable pipeline humming along, I could focus on what really mattered: building a hybrid star schema that handled the tricky many-to-many payment relationships, and creating clean, business-ready datasets that powered meaningful analytics dashboards using Databricks' native visualization capabilities.
System Architecture & Data Flow
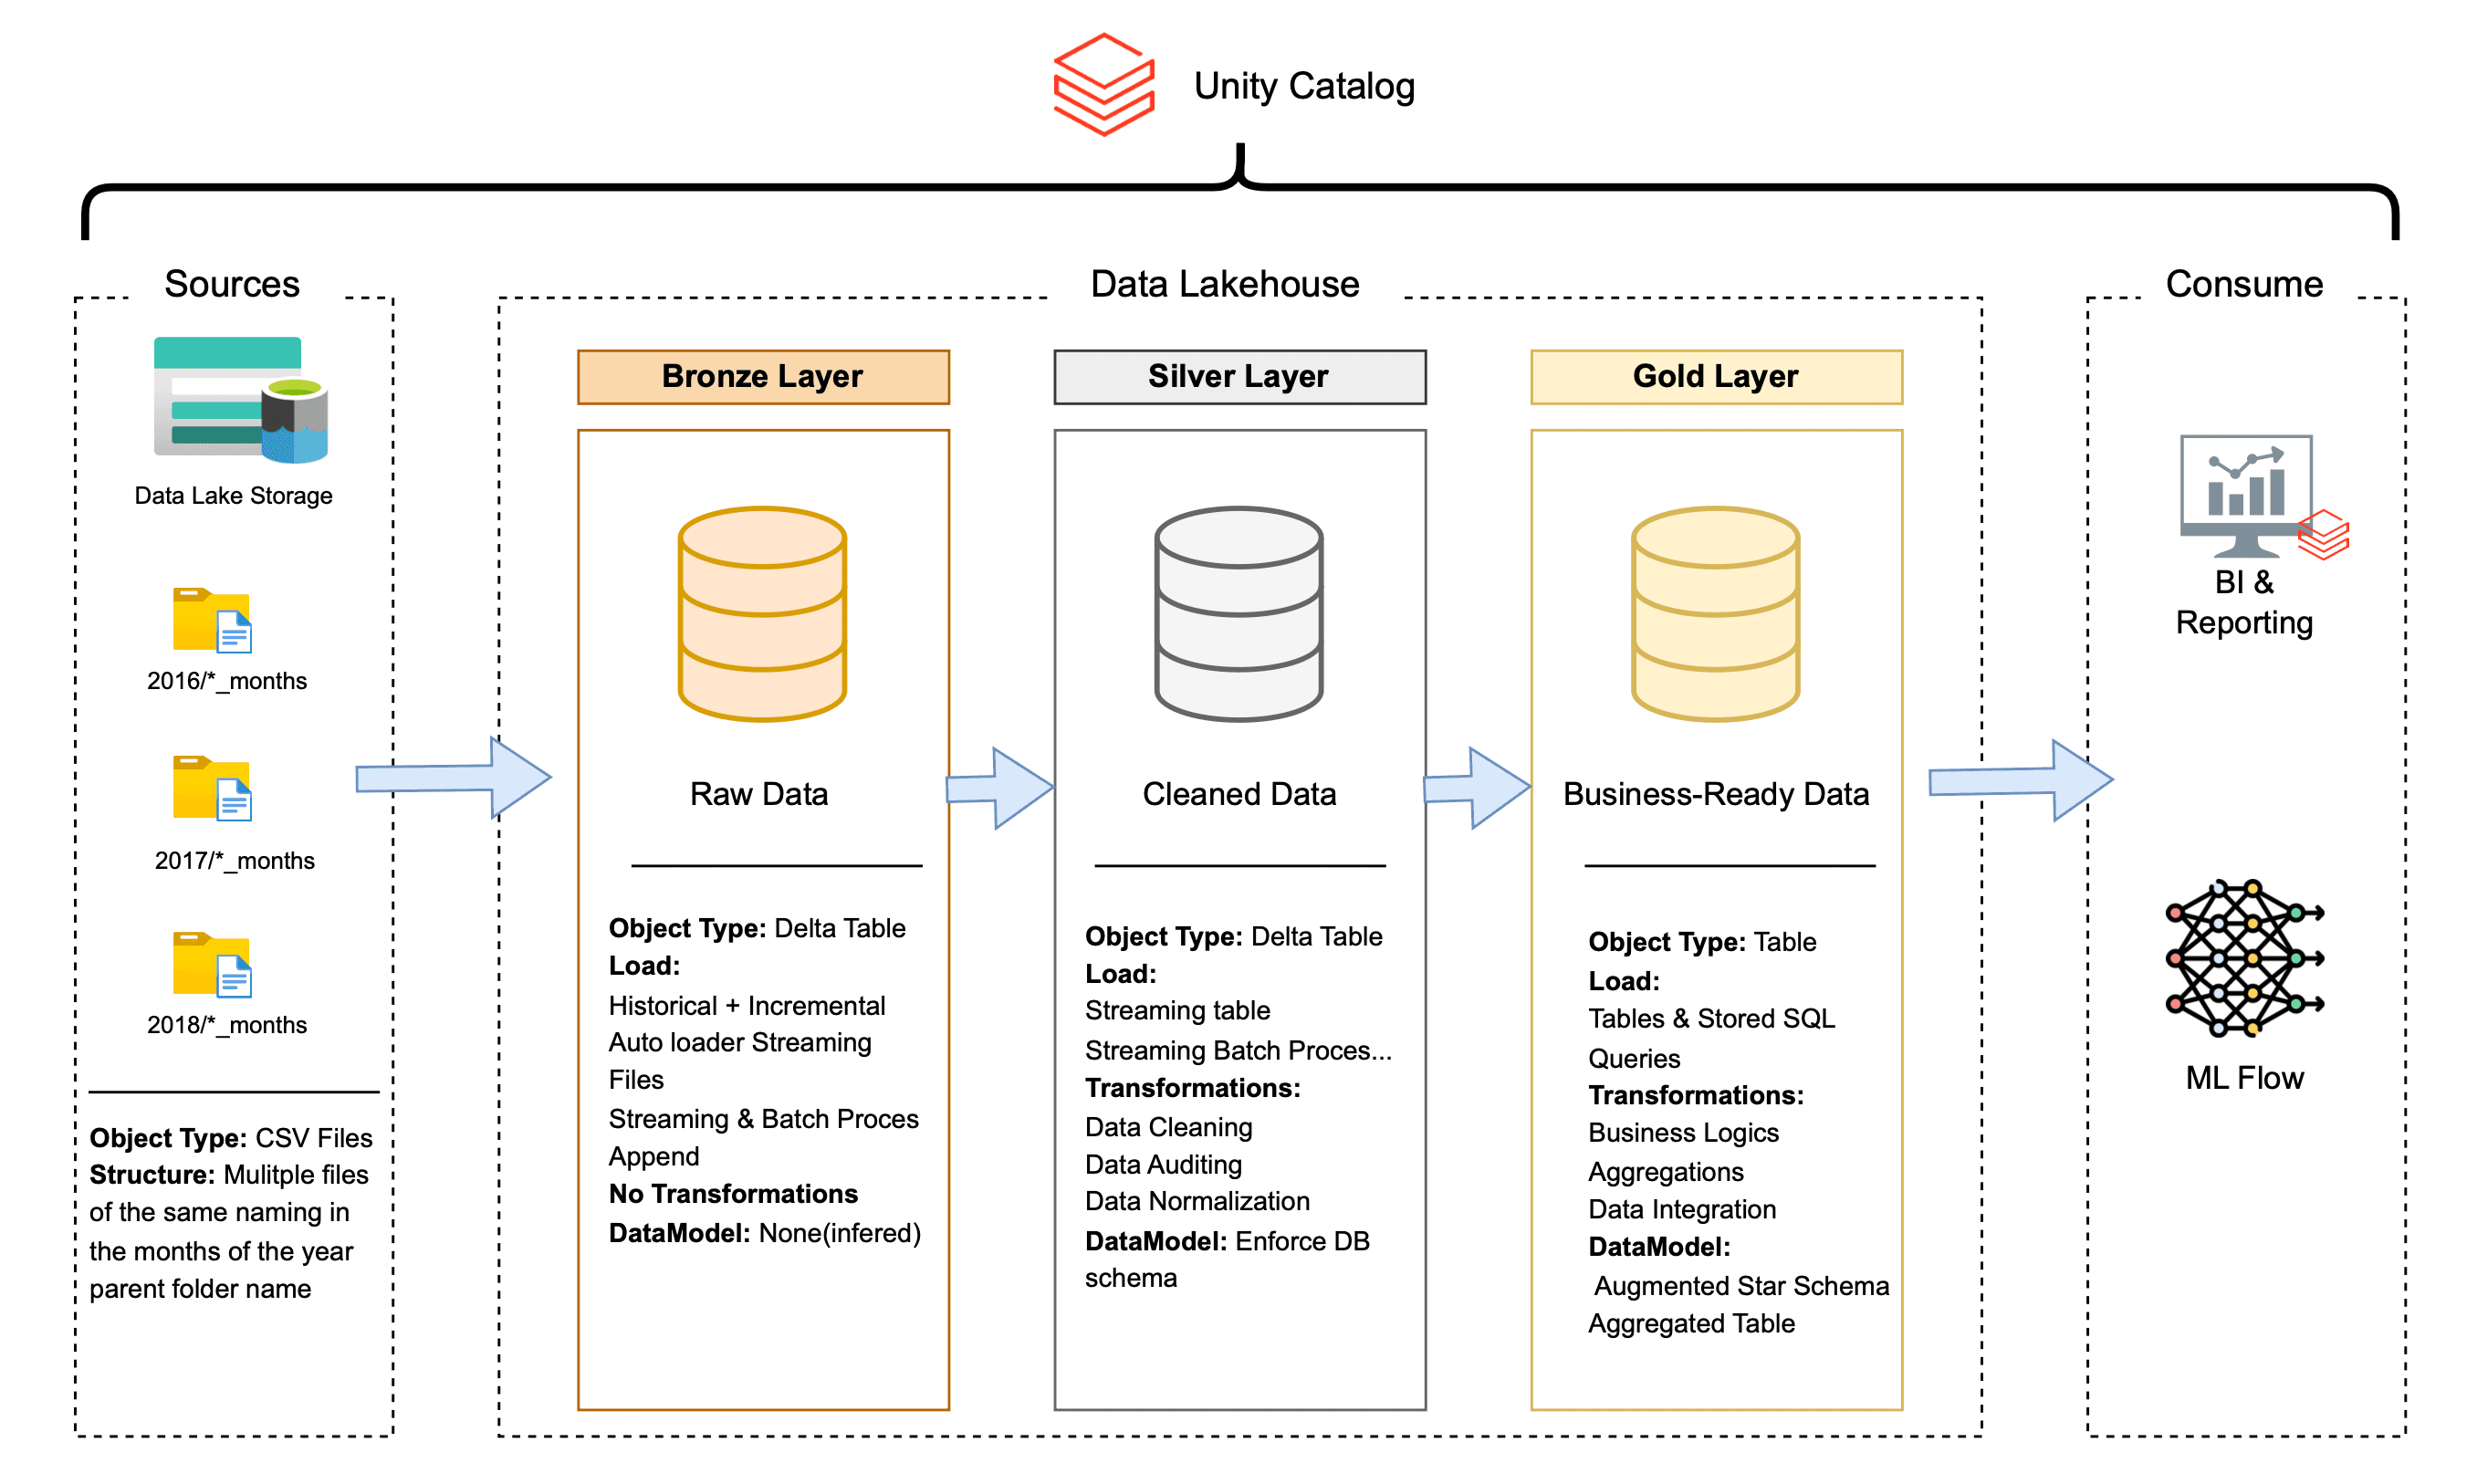
Medallion Architecture That Actually Works
Bronze Layer (Raw Truth)
Purpose: Immutable landing zone for raw source data
Strategy: Dual ingestion pattern—batch for static dimensions, Auto Loader streaming for time-based facts
Philosophy: Preserve everything exactly as it arrives; clean it later
Silver Layer (Clean & Conformed)
Purpose: Apply business logic and enforce data quality
Key Innovation: "Blueprint and Construction" pattern—single schema definition drives all casting and validation
Smart Partitioning: Events partitioned by their actual event time (not ingestion time) for better query performance
Gold Layer (Decision-Ready)
Purpose: Modeled for how the business actually thinks and works
Output: Hybrid star schema with bridge tables where needed, plus customer aggregations for future analytics
Secret Sauce: Control table pattern that makes everything idempotent and self-managing
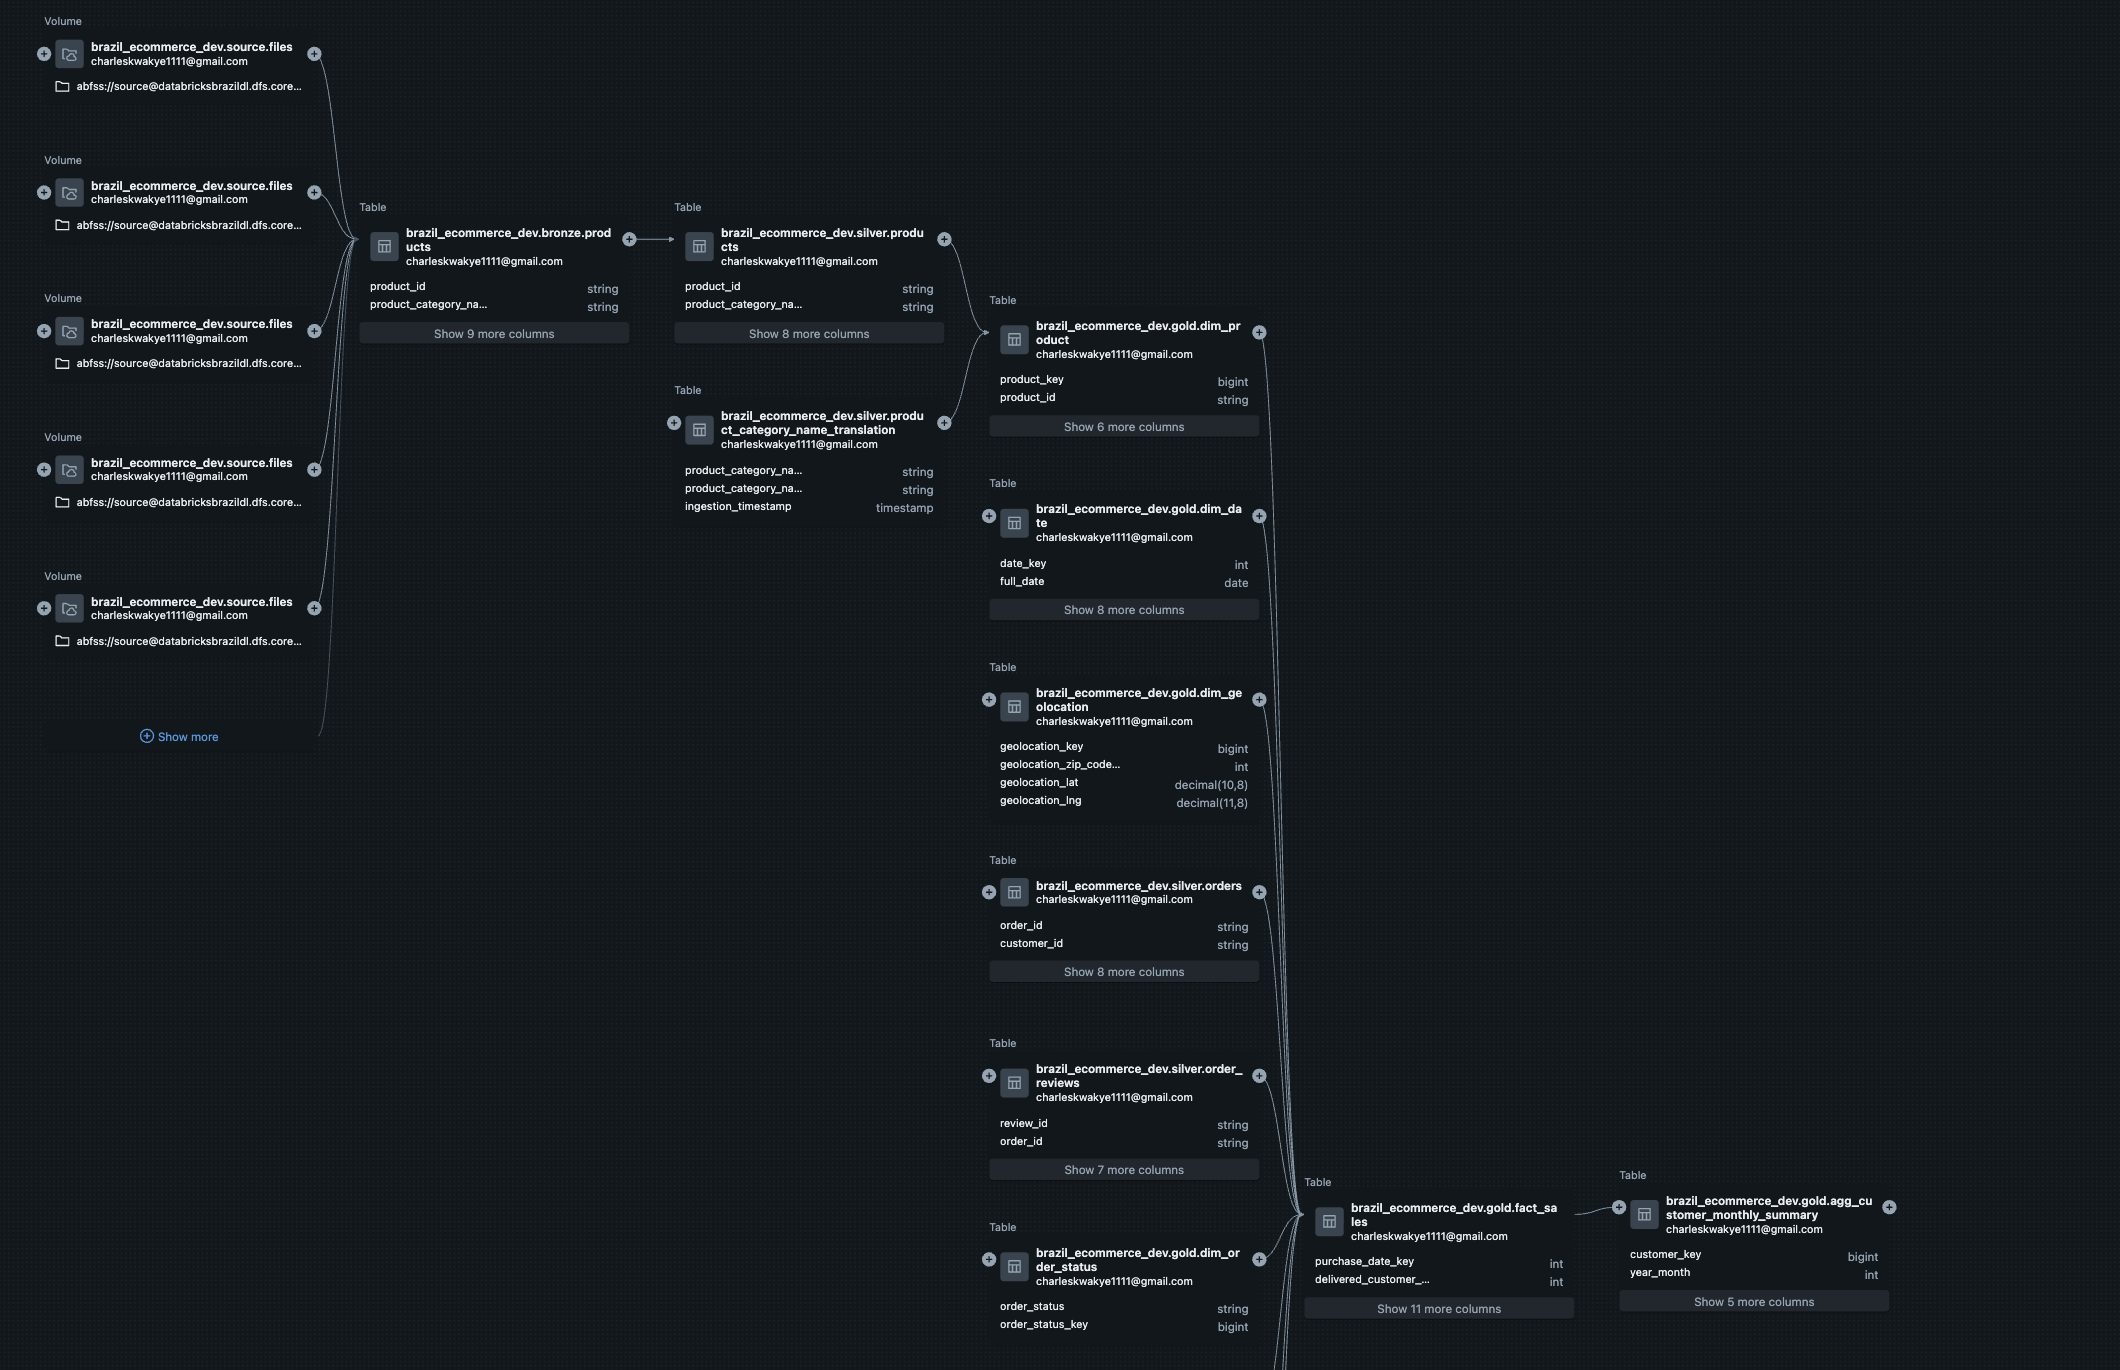
Complete data flow showing how each layer builds on the previous one
The Control Table Pattern (My Favorite Engineering Decision)
The Challenge: How do you build a pipeline that can handle both massive historical backfills and tiny incremental updates with the same code?
The Solution: A single table with one column (processed_month) that acts like a checkpoint. The logic is elegantly simple: discover what's available, check what's been processed, do only the new work, and remember success for next time.
Why This Is Efficient:
First run processes everything (automatic backfill)
Subsequent runs process only new data (incremental by design)
Failed runs can resume exactly where they left off
The system remembers its own state
Zero configuration needed for different scenarios
Data Modeling: From Chaos to Clarity
The Schema Journey
The Discovery: When I first sketched the relationships in dbdiagram.io, I thought I was looking at a straightforward star schema. Then I hit the payments table and realized one order could have multiple payment types. Traditional star schemas hate many-to-many relationships.
The Evolution: Started by trying to force it into a pure star schema (spoiler: didn't work). Then realized: E-commerce is messy; my model needed to reflect reality, not textbook purity. Finally designed: Hybrid star schema with bridge tables where needed.
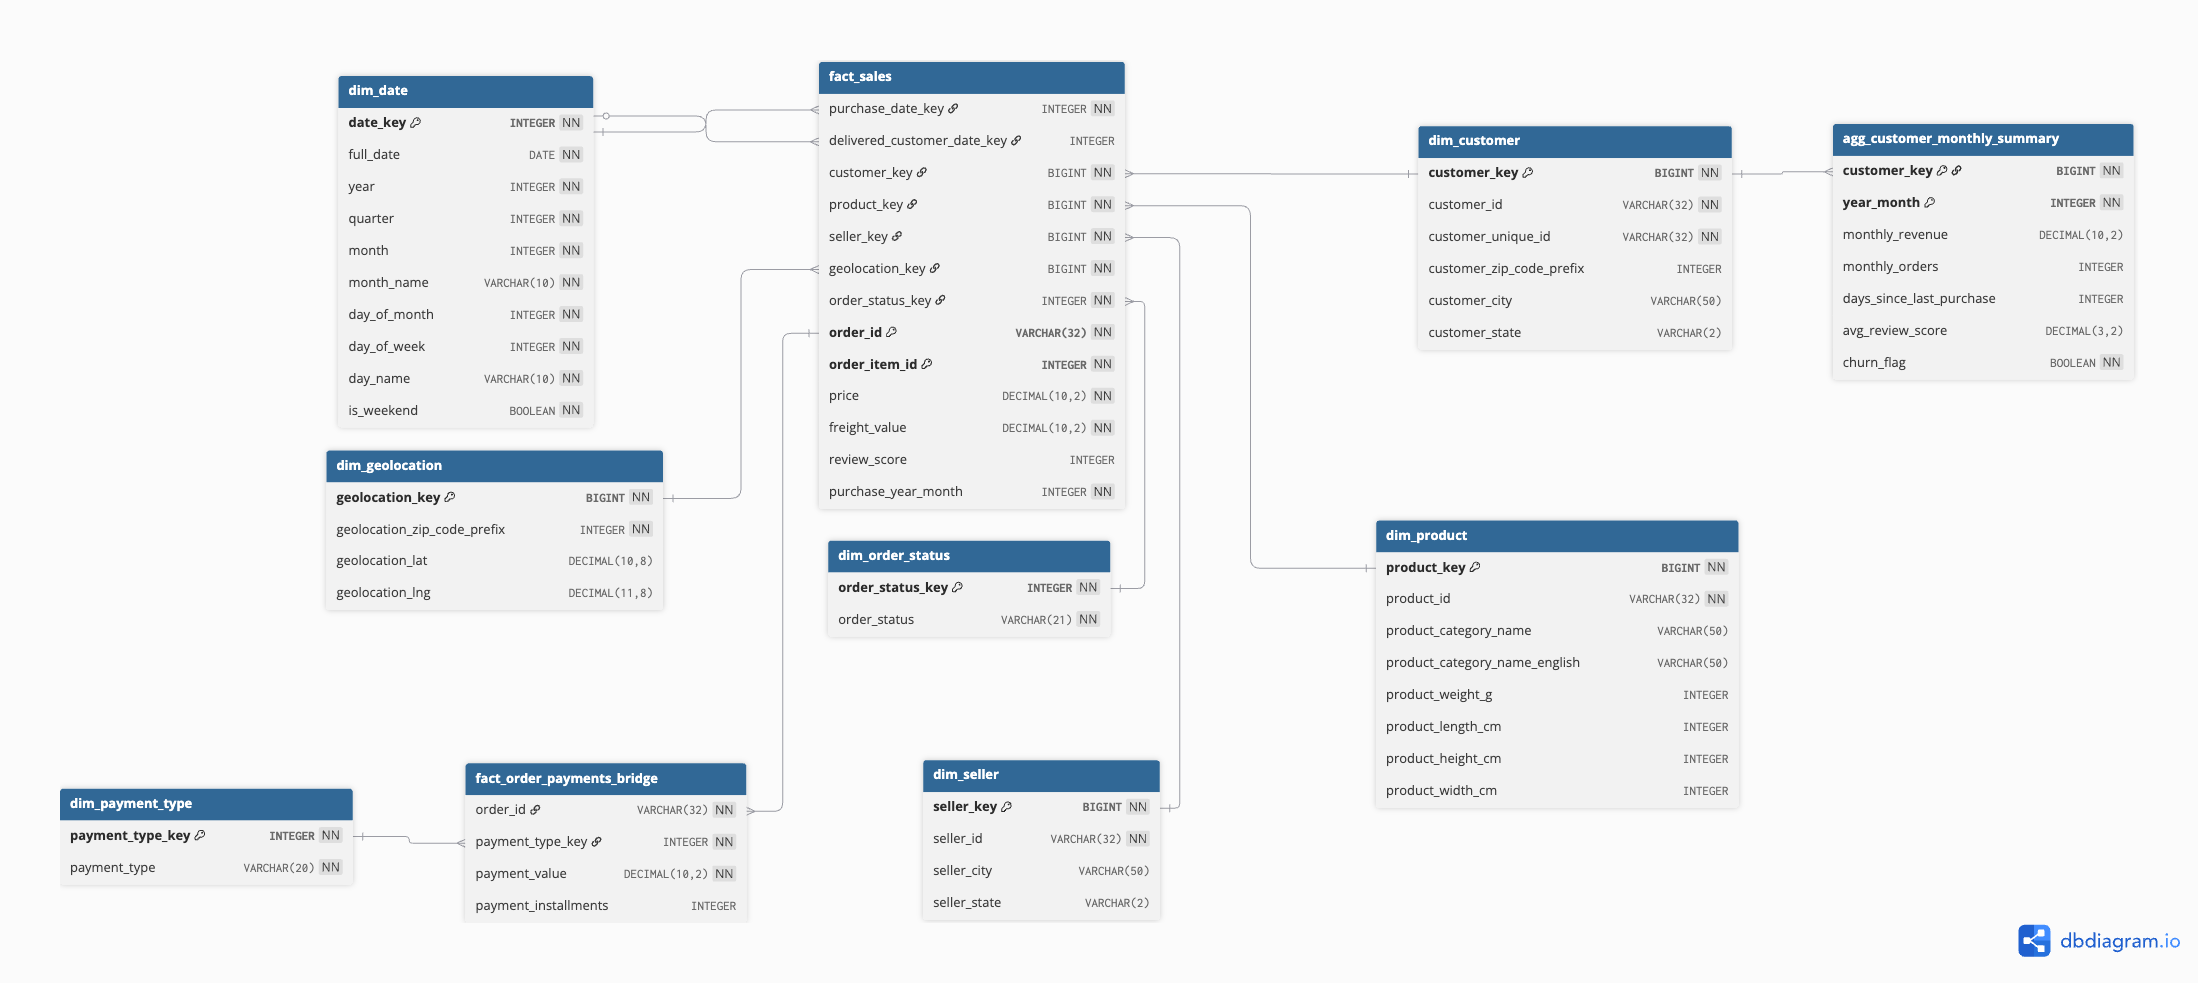
Final Schema: Hybrid Star with Bridge Tables
Core Architecture:
Central Fact Table (fact_sales): One row per order line item—the grain that makes business sense
Dimension Tables: Customer, Product, Seller, Date, Geography—all the context you need
Bridge Table (fact_order_payments_bridge): Handles the many-to-many payment relationships gracefully
Customer Summary Table (agg_customer_monthly_summary): Customer behavioral data aggregated for analytics and future ML initiatives
Final hybrid star with payment bridge and ML aggregate
Why This Design Works in Practice:
Fast Analytics: Star schema patterns give you sub-second query performance
Data Integrity: Bridge tables preserve complex relationships without losing information
Flexible Analysis: Supports comprehensive business intelligence workloads with room for future ML expansion
Multiple Grains: Order-level for operations, customer-level for marketing
Key Insight: I learned that the "perfect" schema from textbooks often breaks when it meets real business data. Sometimes you need to be pragmatic, not purist.
Implementation Process: Building It Right
Ingestion (Source → Bronze)
The Foundation: Parameterized notebooks with clean naming (dropped those ugly olist_ prefixes) and clear checkpoint strategies.
The Pattern: Static Dimensions: ingestion/ingest_bronze.ipynb for one-time batch loads. Time-Based Facts: ing_incremental_bronze.ipynb using Auto Loader magic.
The Outcome: Immutable Bronze Delta tables that became the foundation for everything downstream.
Transformation (Bronze → Silver)
The Challenge: Nine tables, each with its own quirks and business rules.
The Solution: processing/process_silver.ipynb notebooks using a "Blueprint and Construction" pattern: Define the target schema once (the blueprint). Let that schema drive casting and validation (the construction). Use foreachBatch to MERGE changes efficiently.
Smart Partitioning Decision: Partition by order_year_month or purchase_year_month (event time, not ingestion time). This turned slow full-table scans into snappy, pruned reads aligned with how analysts actually filter data.
Modeling (Silver → Gold)
The Architecture: Eight focused notebooks, each with a single responsibility: 0_control_table.ipynb - The state manager, 1_dim_date.ipynb through 4_dims_location.ipynb - Dimension building, 5_fact_sales.ipynb - The central fact table, 6_fact_order_payments_bridge.ipynb - Many-to-many resolver, 7_agg_customer_monthly_summary.ipynb - Customer analytics aggregations.
Orchestration Evolution:
V1: Complex master/sub-job setup (worked, but brittle)
V2: Single discover-and-log loop with control table (simple, transparent, bulletproof)
Master/sub-job orchestration from the earlier, more complex version
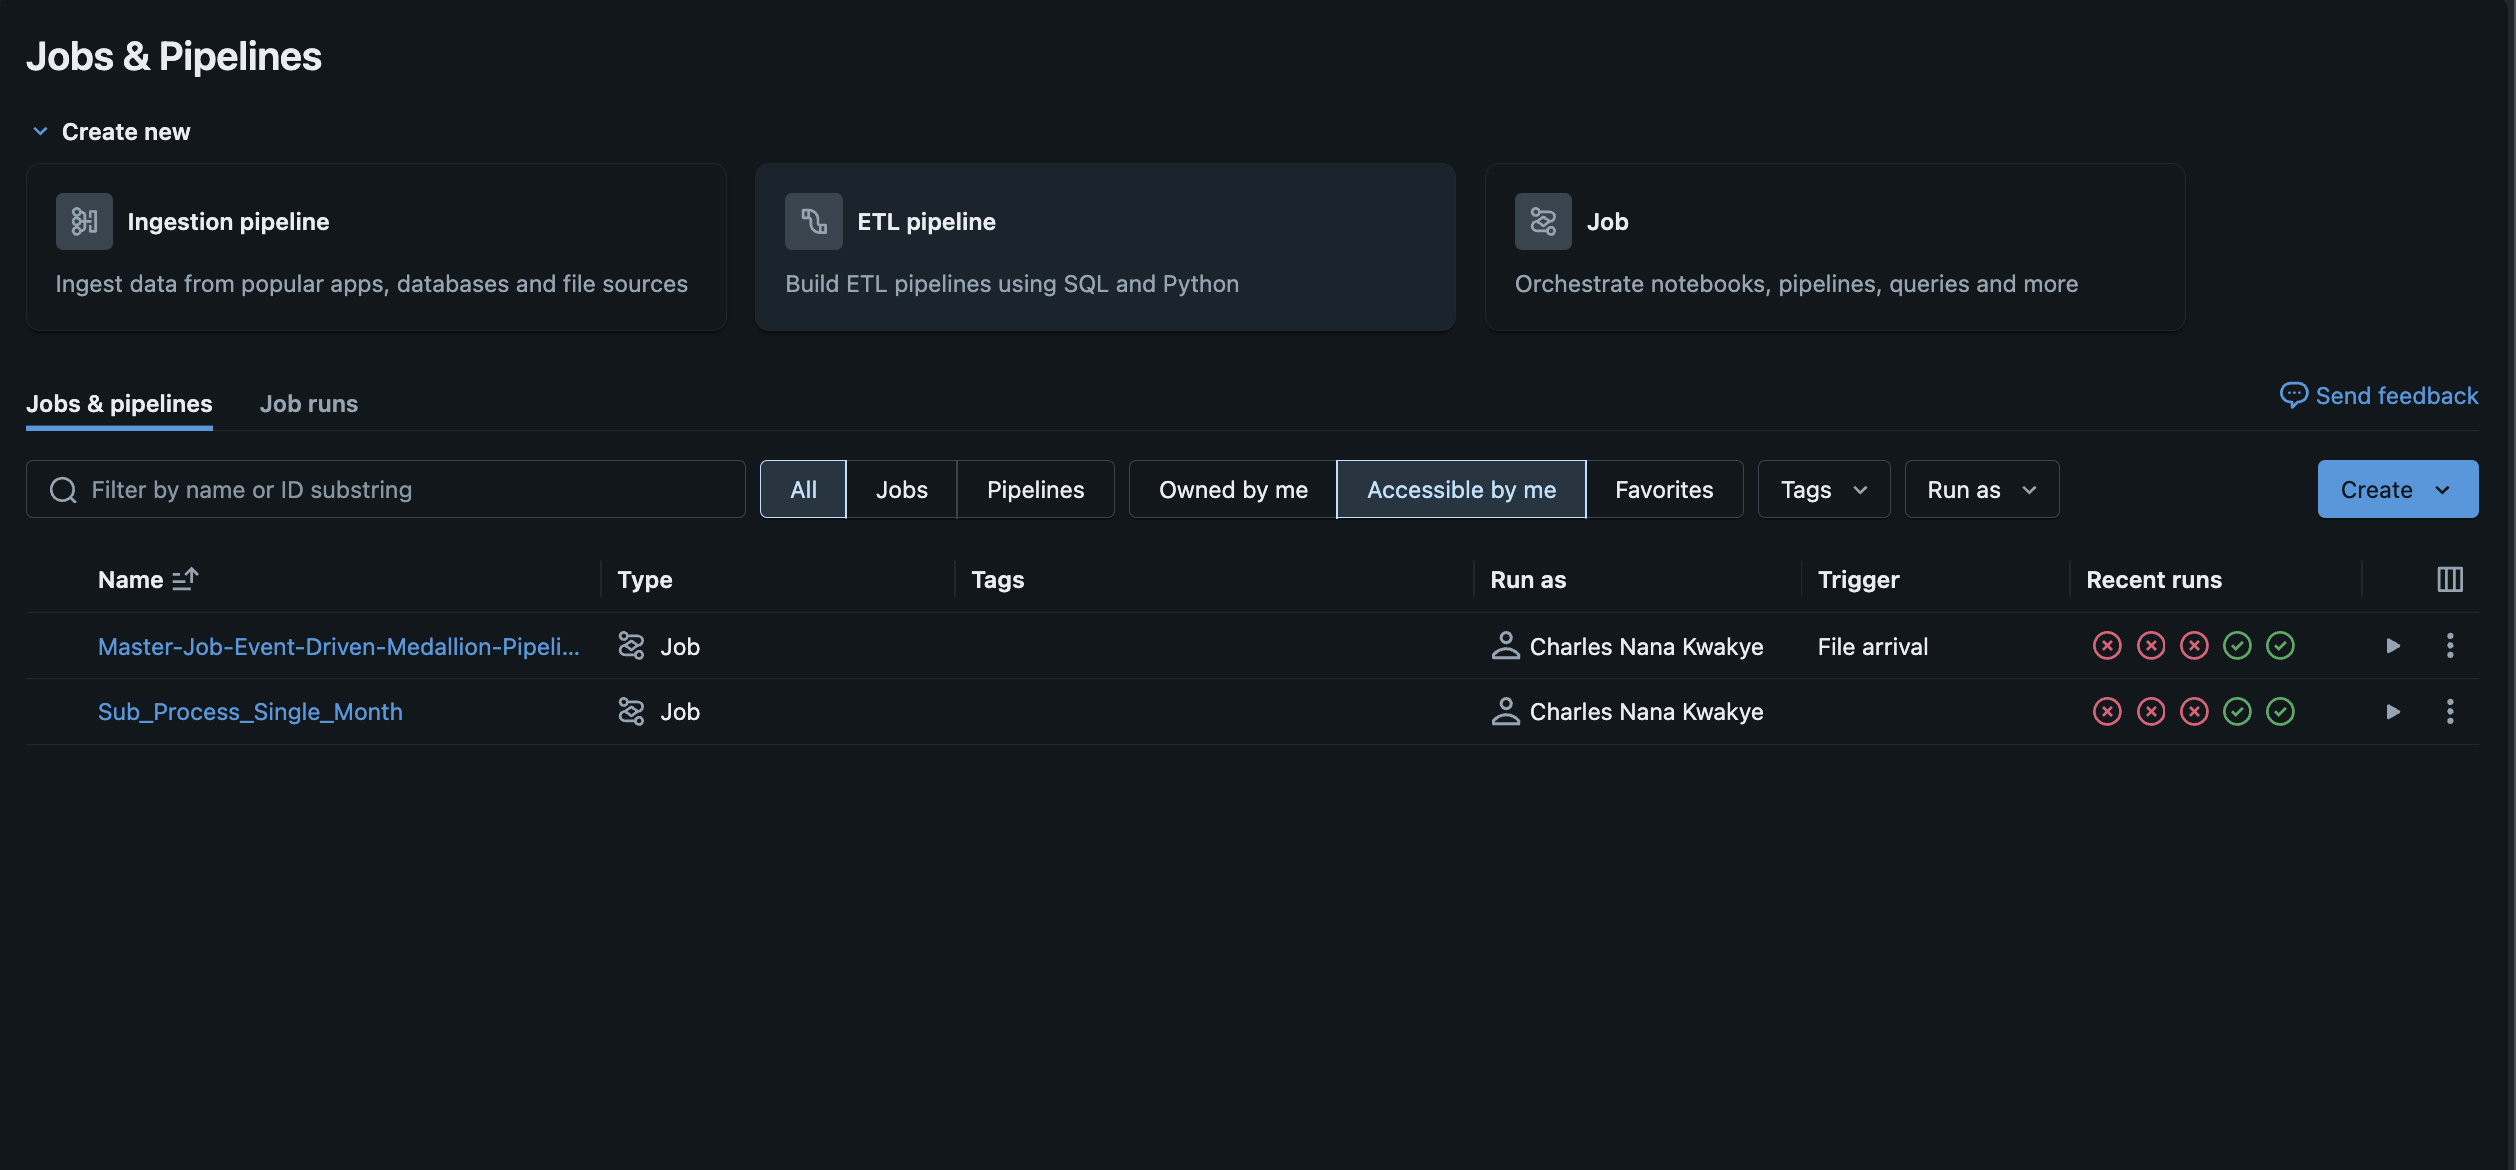
Orchestration & Monitoring
Production-Ready Operations:
Sequential Dependencies: Bronze → Silver → Gold → Customer Analytics (no step runs unless the prior succeeded)
Smart Parameters: Pass load_date/month context through the entire pipeline using Databricks Workflows
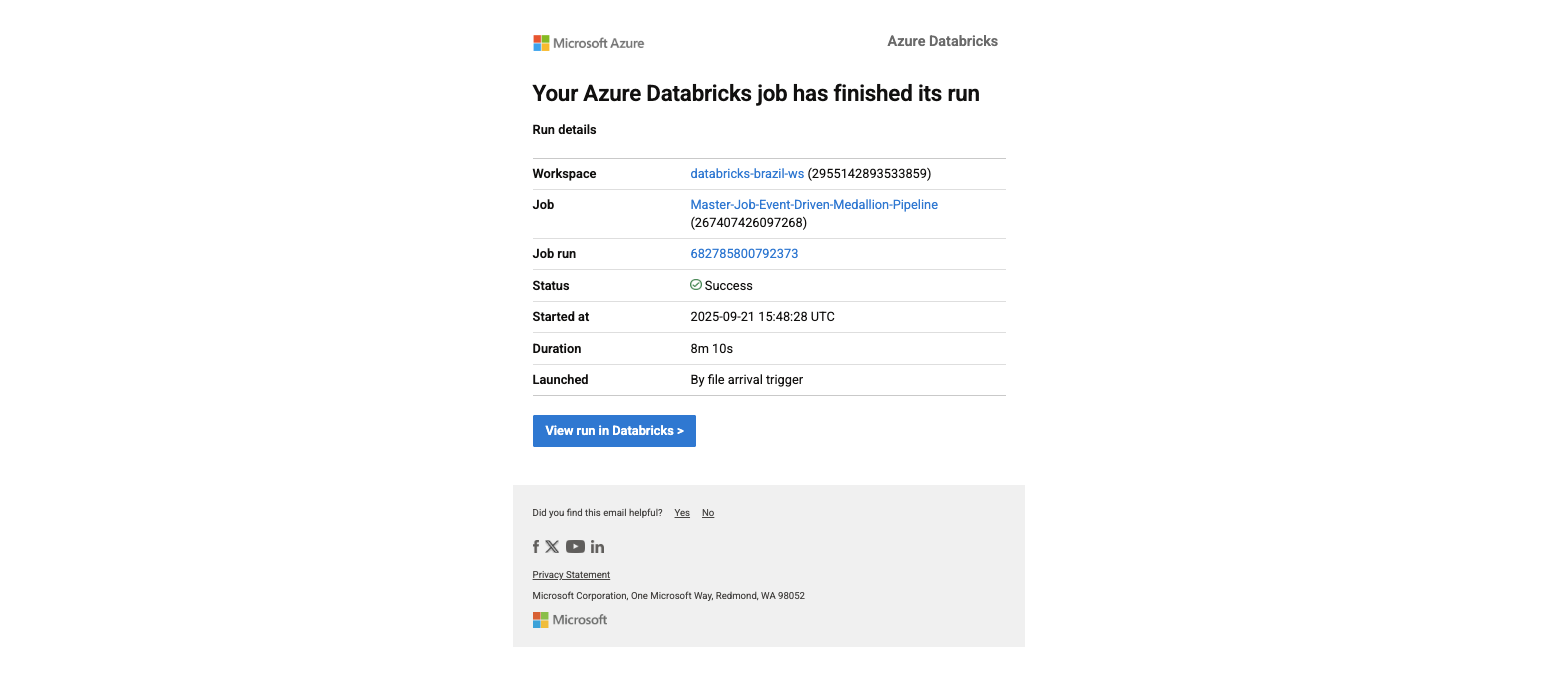
Real Alerts: Webhook notifications for success, actionable email alerts for failures configured within Databricks
Success notification with context
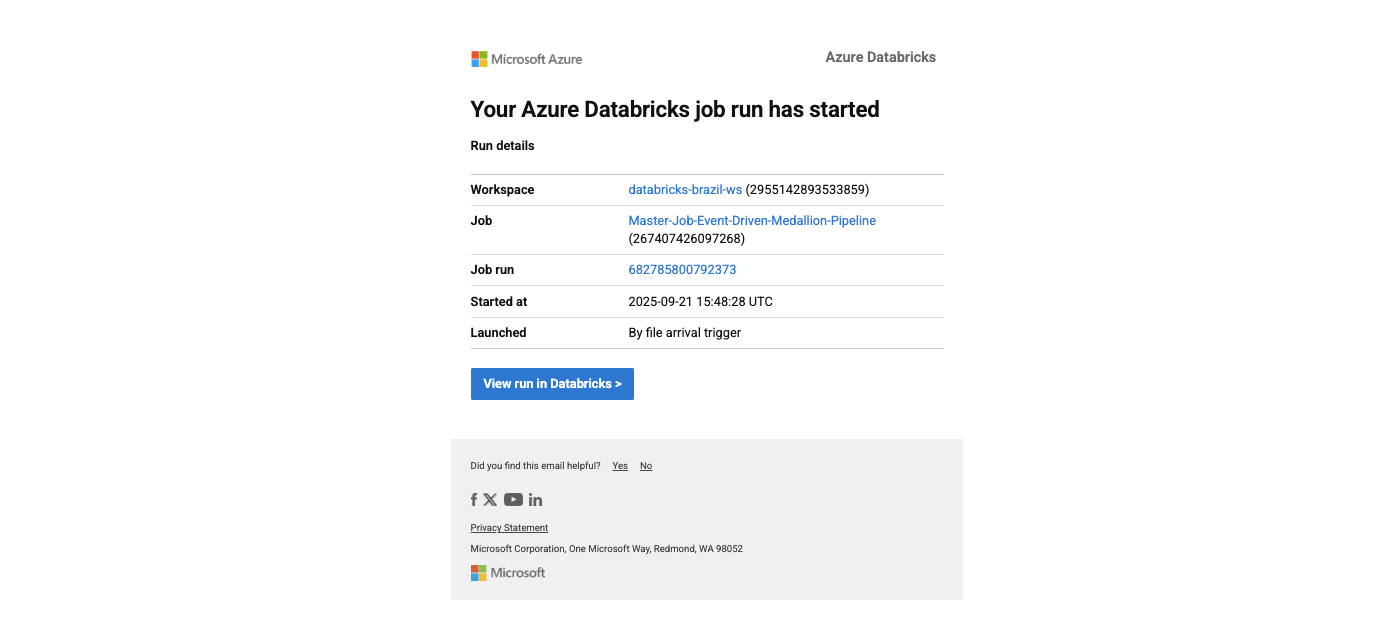
Job started notification
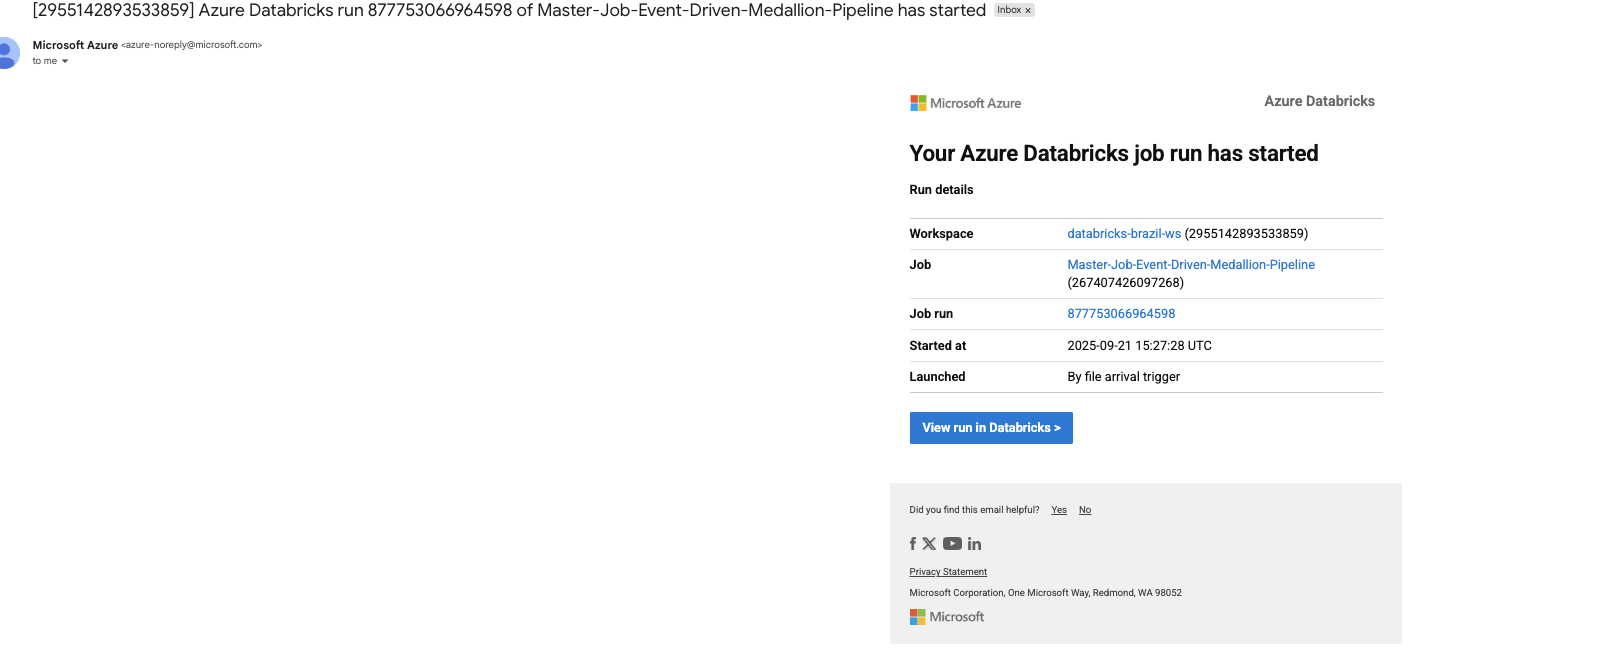
File arrival notification
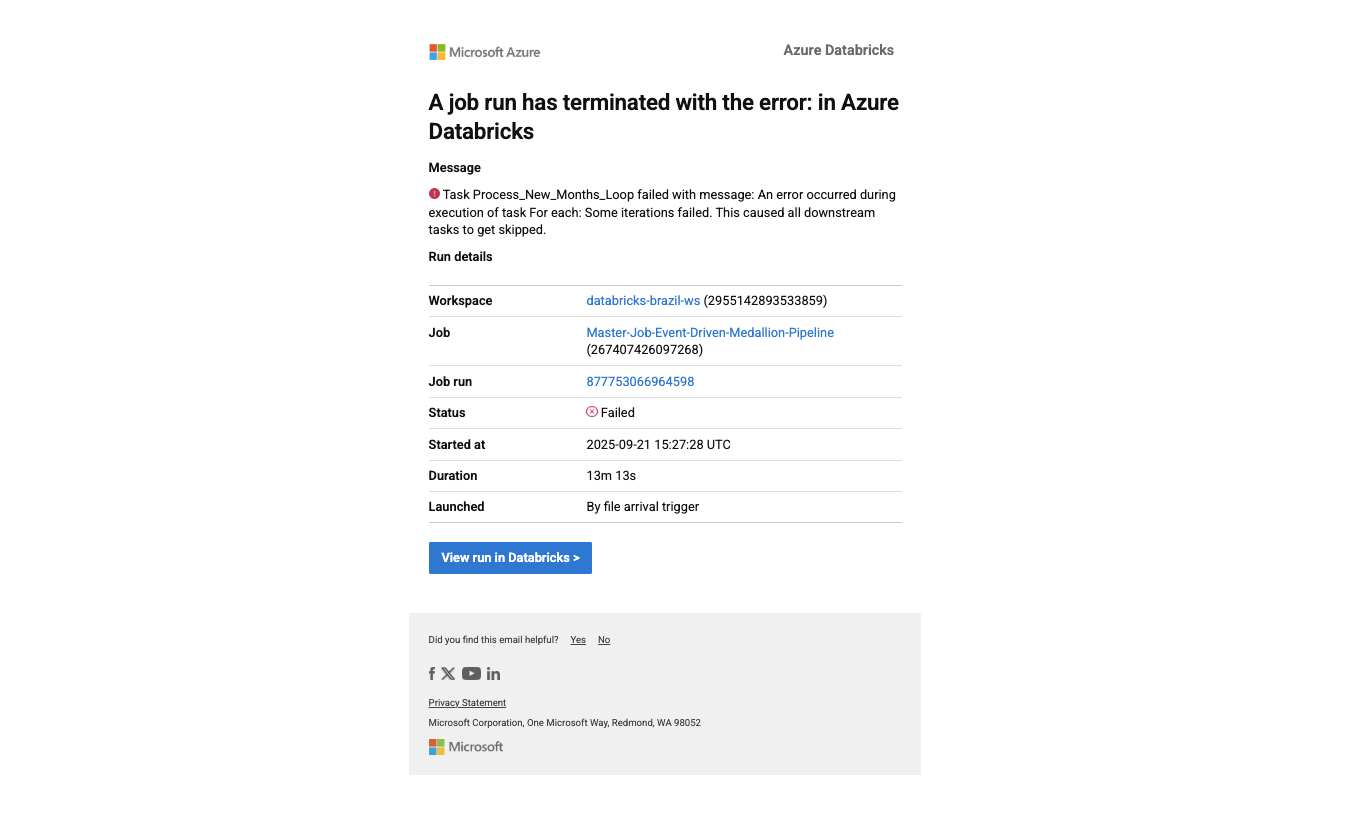
Failure alert with actionable information
Challenges & Solutions: The Real Stories
The Split That Lied
The Setup: I was so proud of my automated month-splitting logic. It looked elegant, handled all nine files, and the results looked perfect in every folder.
The Plot Twist: During validation, I checked an August order against its payment records. They were scattered across different monthly folders. My "intelligent" algorithm had been splitting tables independently, breaking the relationships that made the data meaningful.
The Fix: I anchored every split to the master orders table timeline. If an order happened in August, ALL related records (payments, reviews, items) stayed in August, regardless of their individual timestamps.
The Validation: I built comprehensive checks—row counts matched, relationship keys aligned, and most importantly, the business story was coherent across tables.
The Learning: Data relationships are sacred. Convenience that breaks truth isn't convenience at all.
Too Clever by Half
The Problem: My first orchestration design had two workflows—one for historical data, one for incremental. It felt sophisticated and handled different scenarios elegantly.
The Reality: It was brittle. The state lived in people's heads. New team members couldn't understand it. Debugging required deep context that only I had.
The Simplicity Revolution: I replaced both orchestrators with a single loop and a one-column control table. The logic was transparent: "What months exist in source?", "What months have we processed?", "Process the difference."
The Outcome: Anyone could understand it in 30 seconds. Debugging became trivial. The system managed its own state.
Bronze vs. Speed
The Dilemma: Purists say Bronze should use strict schemas. Pragmatists say use inferSchema for speed. I needed to ship fast but also be correct.
The Decision: I embraced inferSchema for momentum in Bronze, then enforced precision in Silver with a single schema blueprint that drove all casting and validation.
Why It Worked: Fast iteration in early stages, absolute correctness where it mattered for business decisions.
Budget Reality Check
The Challenge: Student budget meant no fancy multi-node clusters or premium features.
The Strategy: Single-node cluster with aggressive auto-termination (cost control). Partition-aware tables that made queries faster even on small clusters. availableNow streaming instead of continuous (batch efficiency with streaming benefits).
The Surprise: The constraints forced better engineering. The pipeline was leaner, faster, and more cost-effective than if I'd had unlimited resources.
Analytics & Visualization: Turning Data into Insights
The Moment of Truth
After months of building infrastructure, the real test came when stakeholders started asking questions. Could the data actually deliver insights that mattered?
Gold Layer Delivers:
Daily Sales Trends: Real-time visibility into revenue patterns using Databricks dashboards
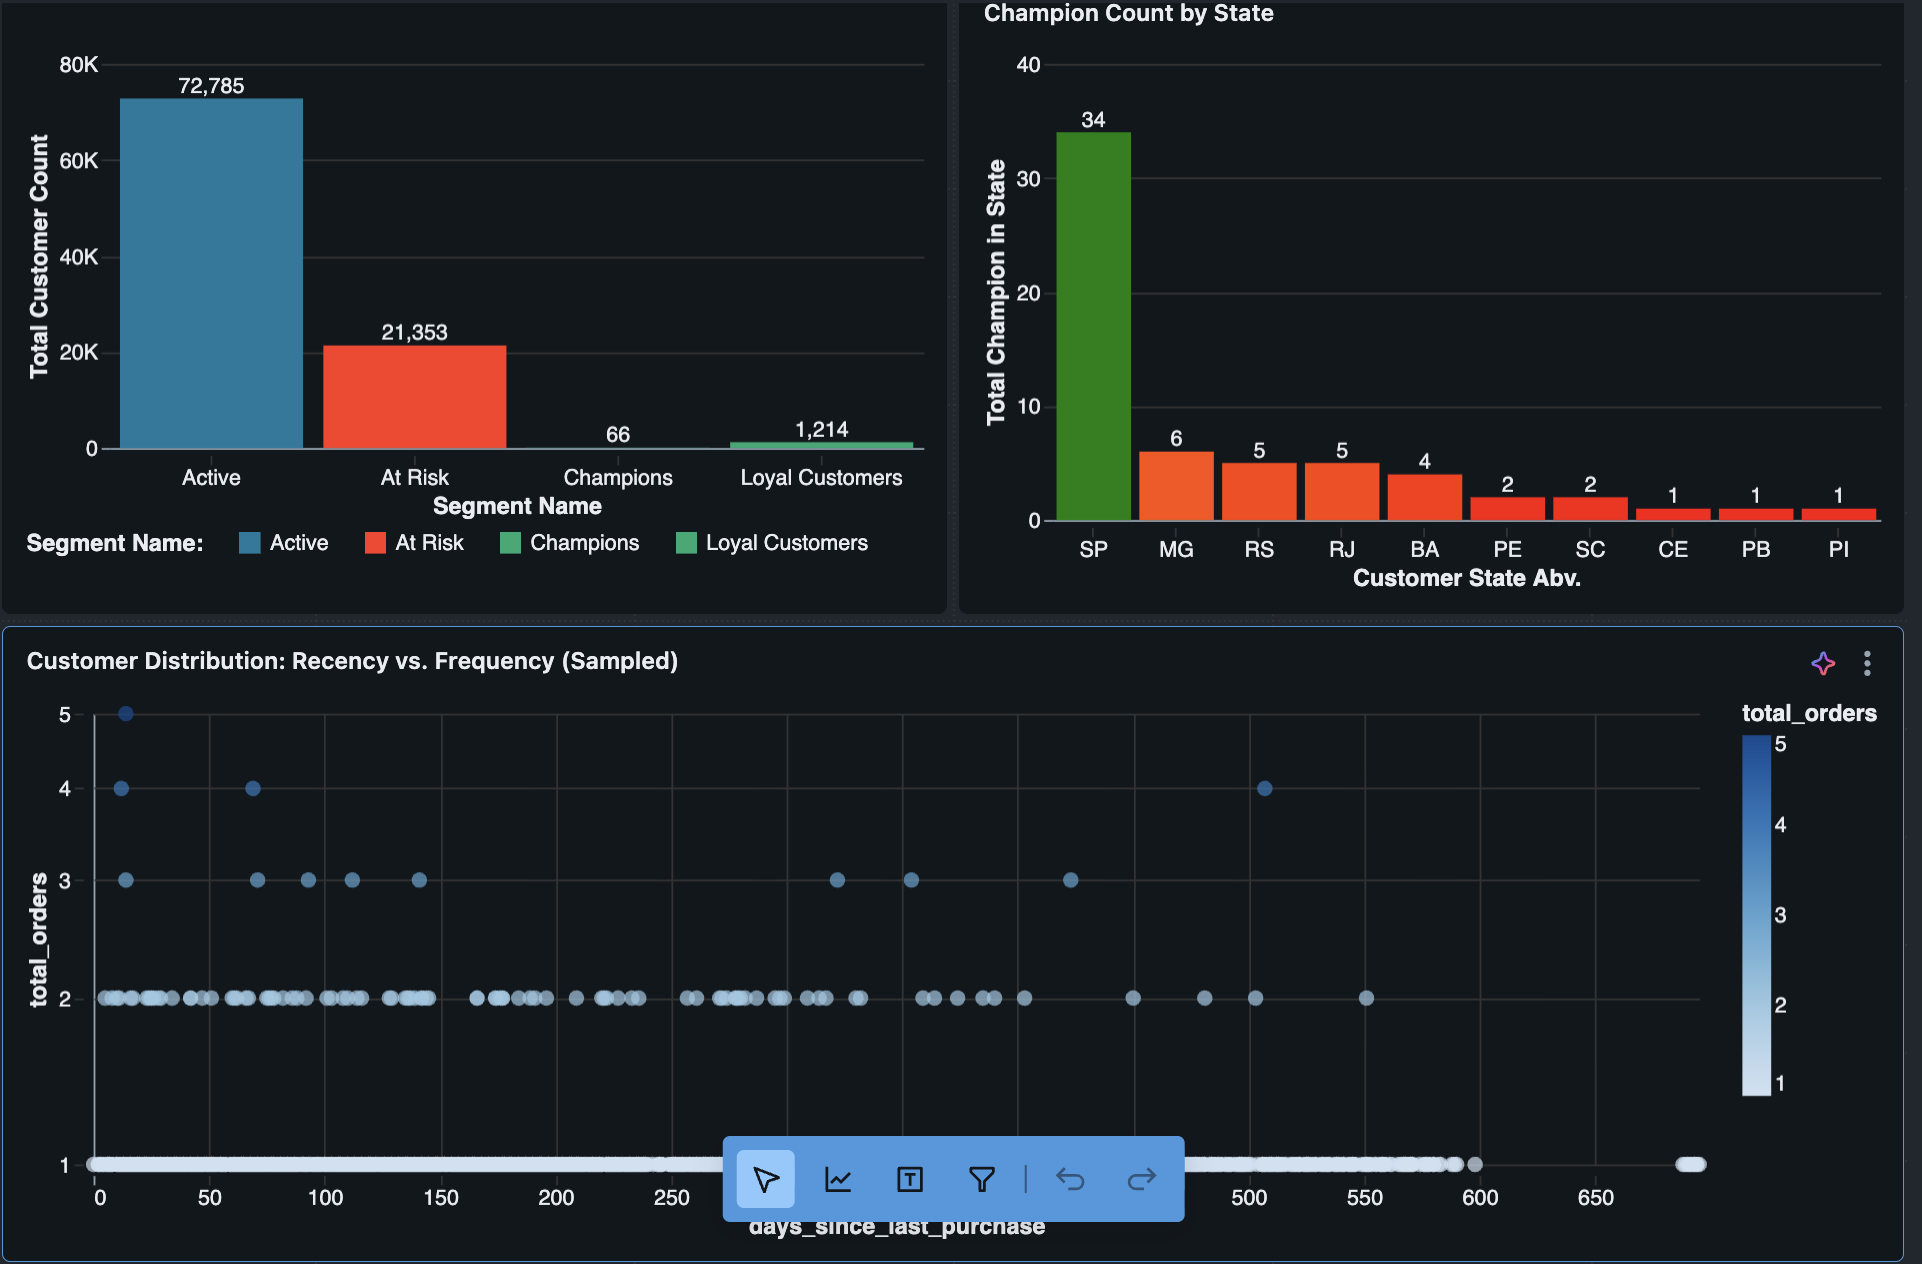
Customer Segmentation: Champions, At-Risk, Lost customers with clear business definitions
Payment Analysis: Understanding payment patterns and methods across different customer segments
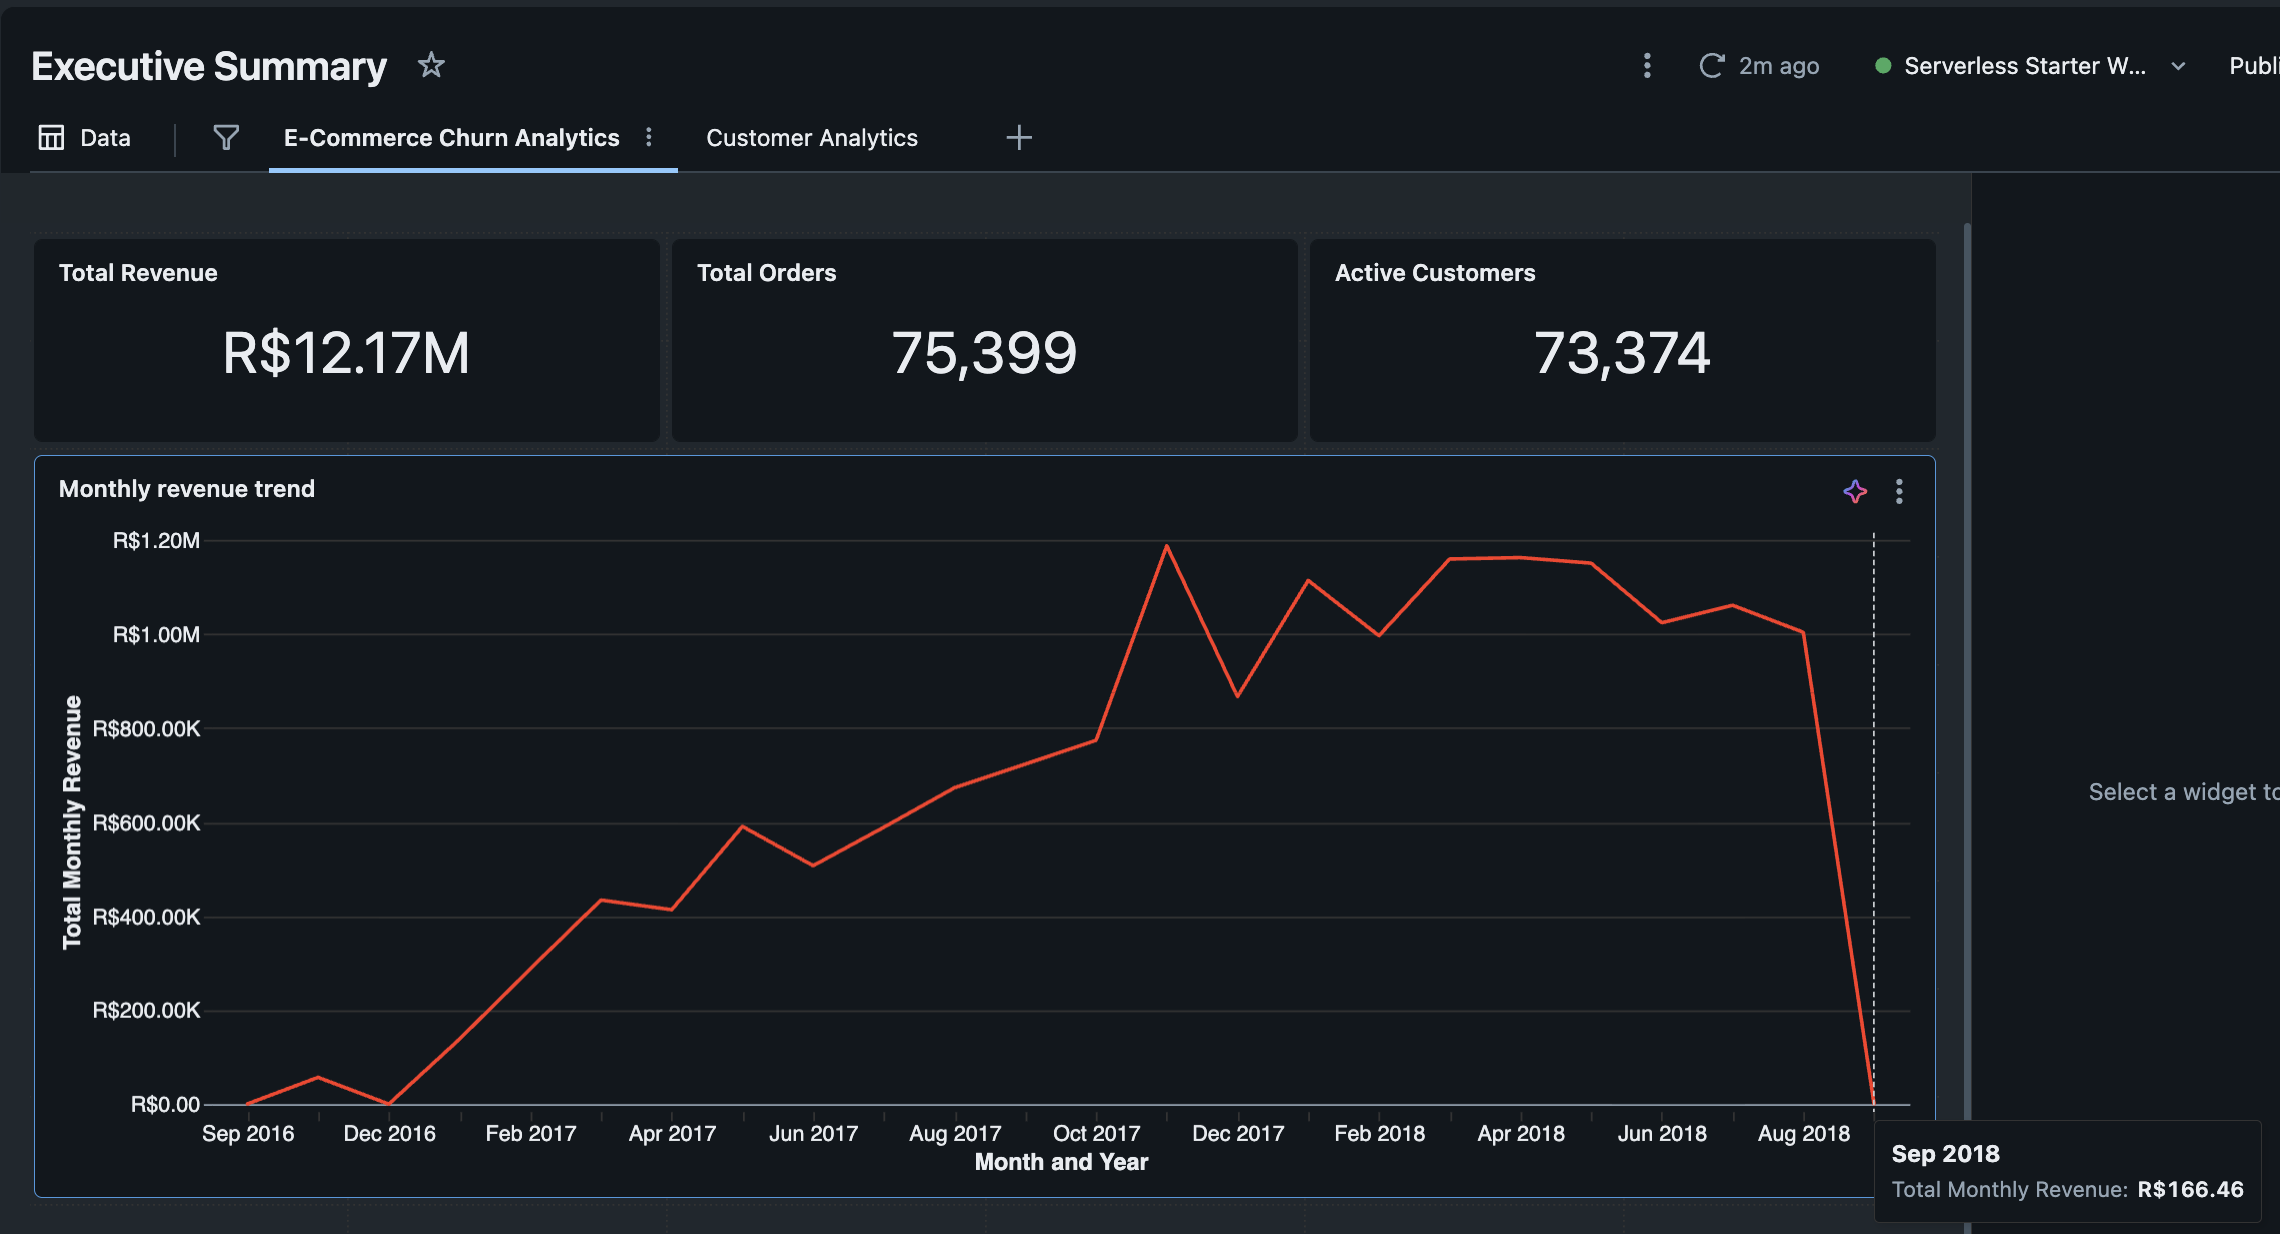
The Incremental Win: The before/after screenshots tell the story—when September data landed, the metrics updated seamlessly, and the business narrative continued without missing a beat.
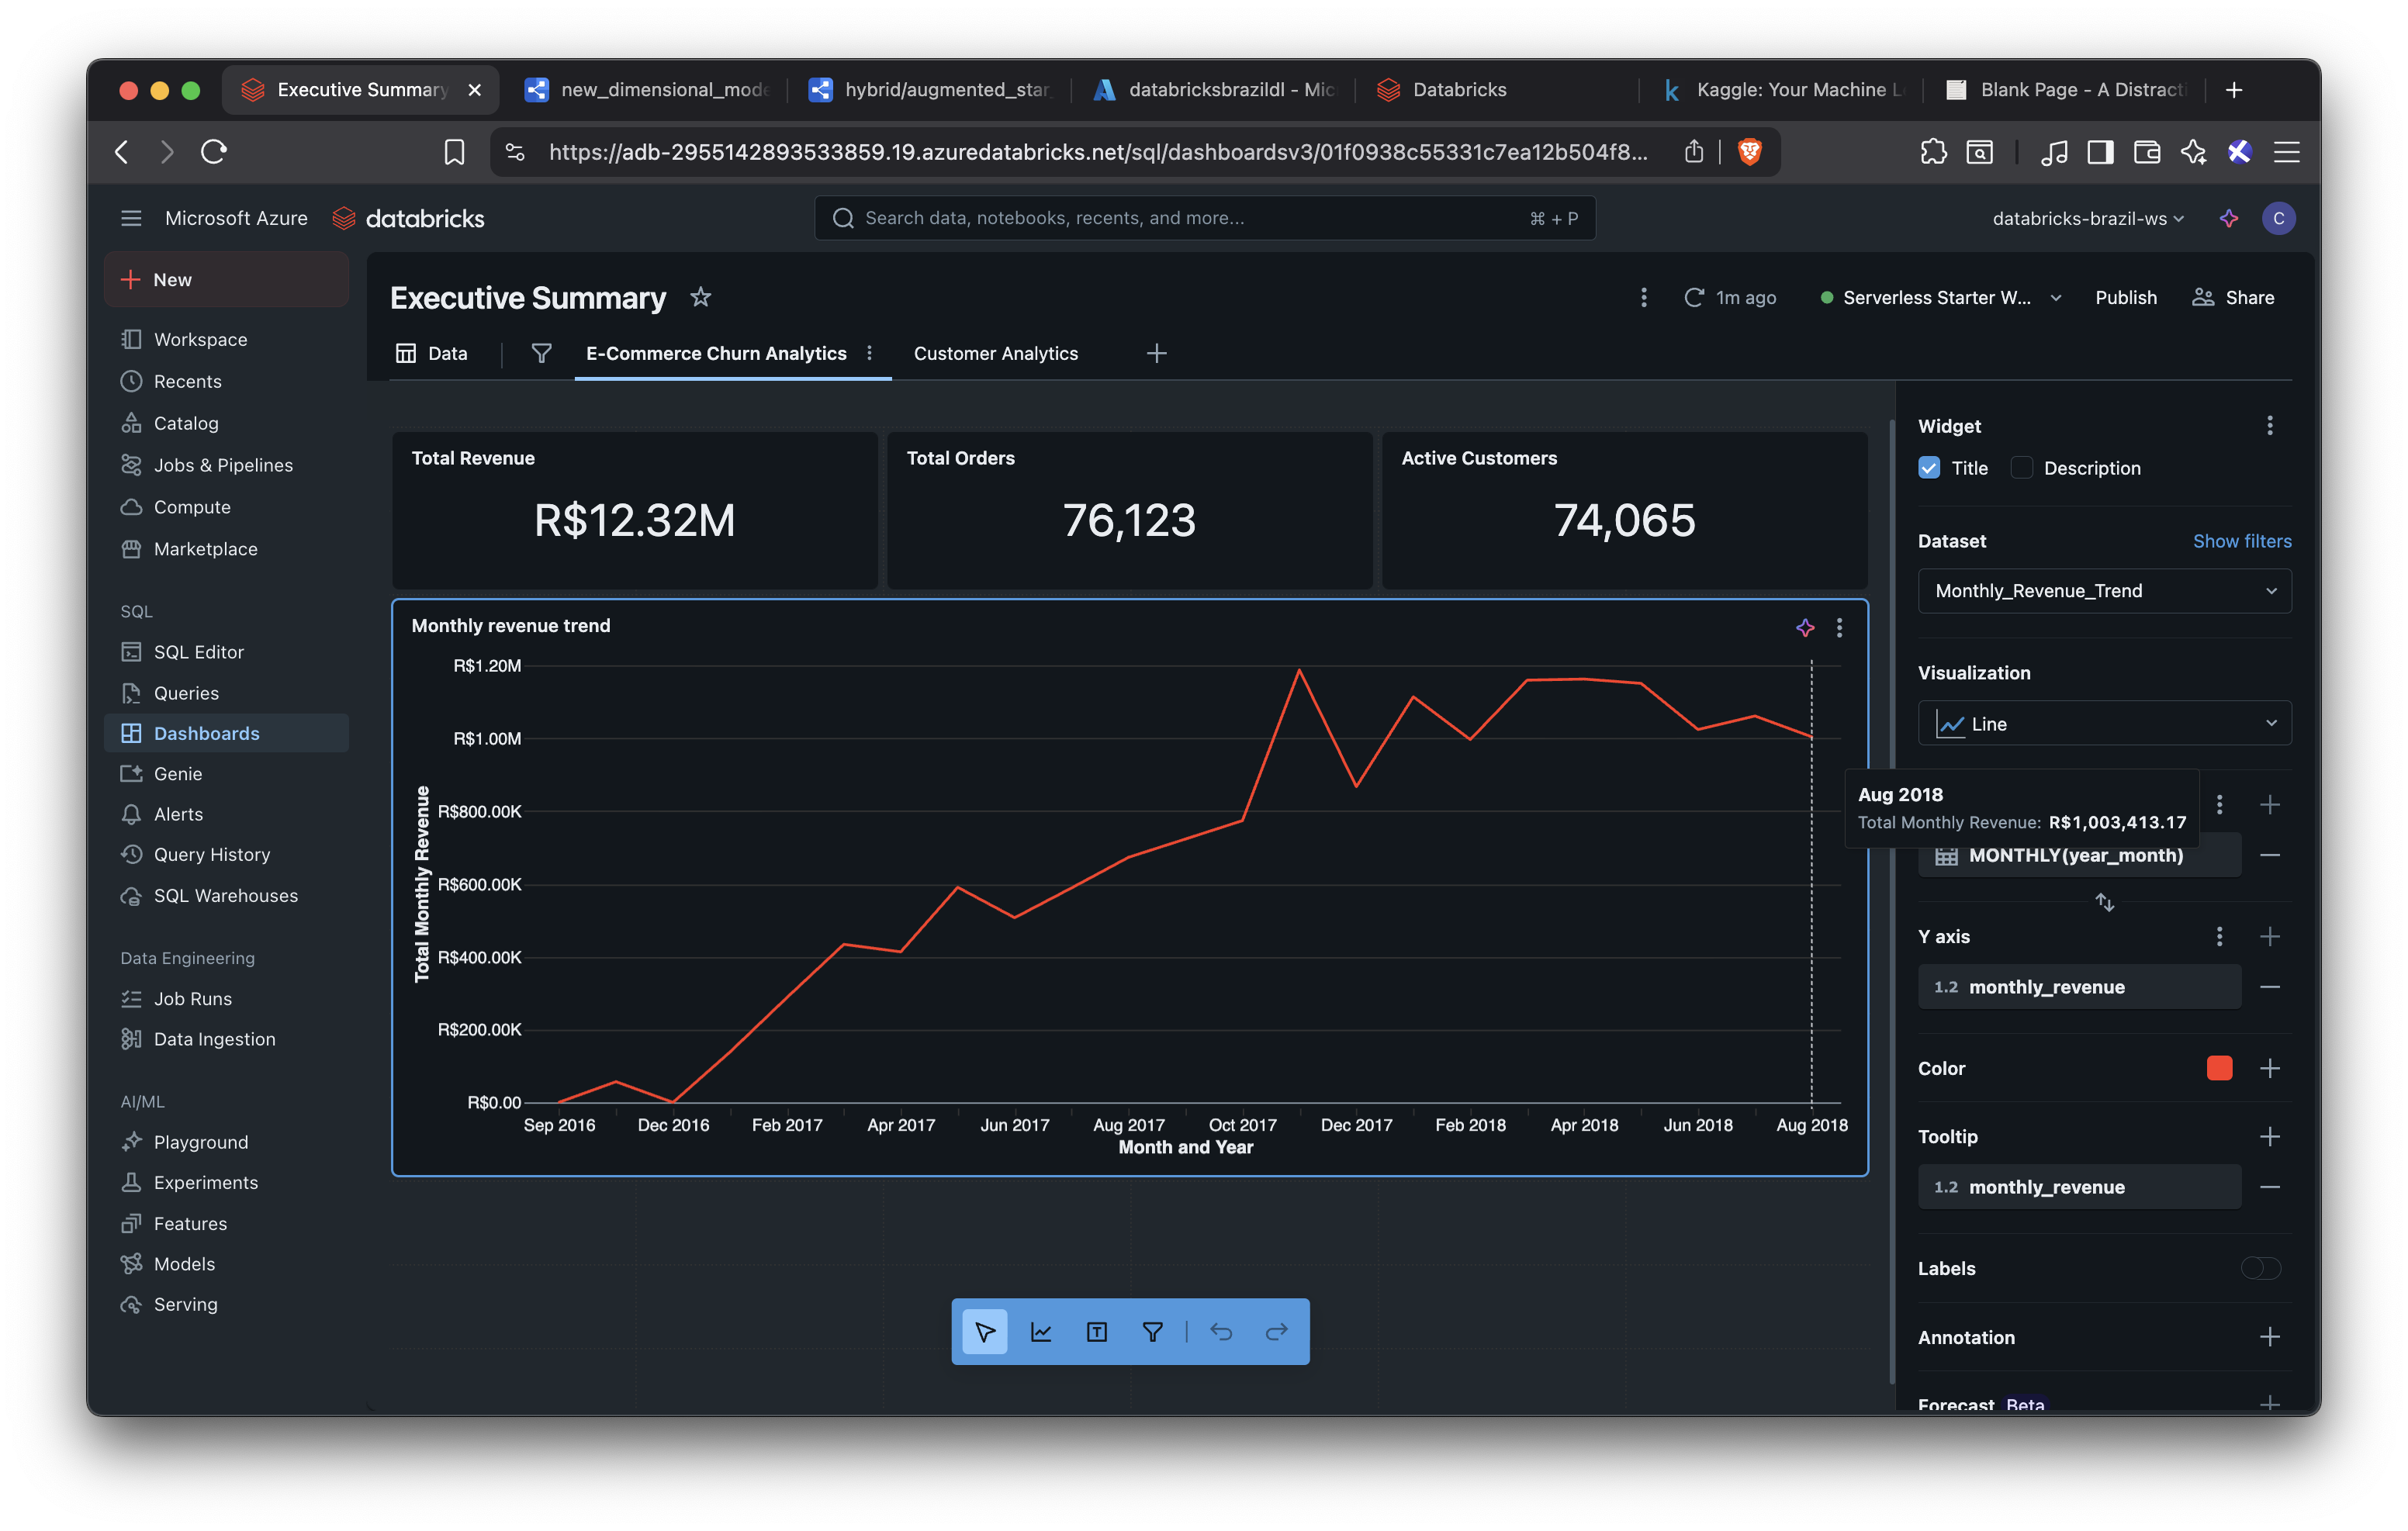
Native Databricks Visualizations: Built comprehensive dashboards directly within the Databricks environment, eliminating the need for external BI tools and keeping everything in one integrated platform.
Analytics dashboard showing historical data through August
Same dashboard updated with September data, showing incremental processing working seamlessly
Customer segmentation analysis showing business insights from the clean data model
Future ML Opportunities
The Foundation is Ready: The agg_customer_monthly_summary table provides the perfect starting point for future machine learning initiatives—customer behavior aggregated by month with features that could support churn prediction, customer lifetime value modeling, and recommendation systems.
What's Next: While ML implementation was planned for a future phase, the current architecture provides clean, aggregated features that make model development straightforward when ready to expand the project scope.
Project Outcome & Key Learnings
This project successfully transformed over 100,000 raw e-commerce records into a reliable, query-optimized analytics platform on a student budget. The final system is not only cost-effective but also fully automated, handling historical backfills and incremental data loads seamlessly.
Key Achievements:
Performance: Transformed massive, slow datasets into a partitioned gold layer where analytical queries now run in seconds
Reliability: Built a self-managing pipeline with automatic recovery, ensuring zero data loss and a complete audit trail
Cost-Efficiency: Delivered the entire project on a minimal budget by using single-node clusters, aggressive auto-termination, and smart architectural choices
Core Lessons Learned:
Design for Business Reality: The most important lesson was to model the data based on the true relationships within it (like complex payment schedules), rather than forcing it into a textbook-perfect schema
Simplicity is Robust: My initial complex orchestration was brittle. I replaced it with a simple, stateful control table that is more transparent, easier to debug, and virtually foolproof
Constraints Drive Better Engineering: The limited budget forced me to find leaner, more efficient solutions. This resulted in a better-designed pipeline than if I had unlimited resources
Next Steps
With a solid data foundation in place, the project is now perfectly positioned for more advanced applications:
Implement Machine Learning: Use the aggregated customer data to build churn prediction and customer lifetime value (LTV) models
Enhance Dashboards: Develop more advanced visualizations, incorporating predictive analytics to forecast sales trends
Move to Real-Time: Transition key fact tables to a true streaming model for near-real-time business insights